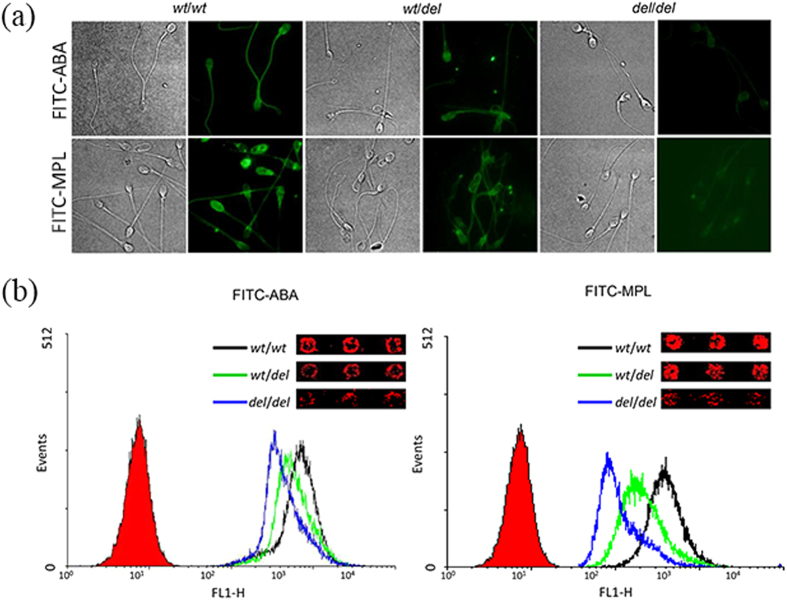
Figure 6. Validation of sperm-lectin binding by fluorescence microscope and FACS.
(a) The different fluorescence signal of sperm with wt/wt, wt/del or del/del genotype labeled with FITC-ABA or FITC-MPL; the fluorescence micrographs of sperm with each genotype shown in right panel and its corresponding phase contrast shown in left panel. (b) FACS analysis of sperm with the three genotypes labeled with FITC-ABA or FITC-MPL; the mean channel fluorescence (MCF) of sperm with wt/wt genotype (black line) shifts being larger than those of sperm with wt/del (green line) or del/del (blue line); insets being the lectin microarray images for the sperm with respective genotypes.

