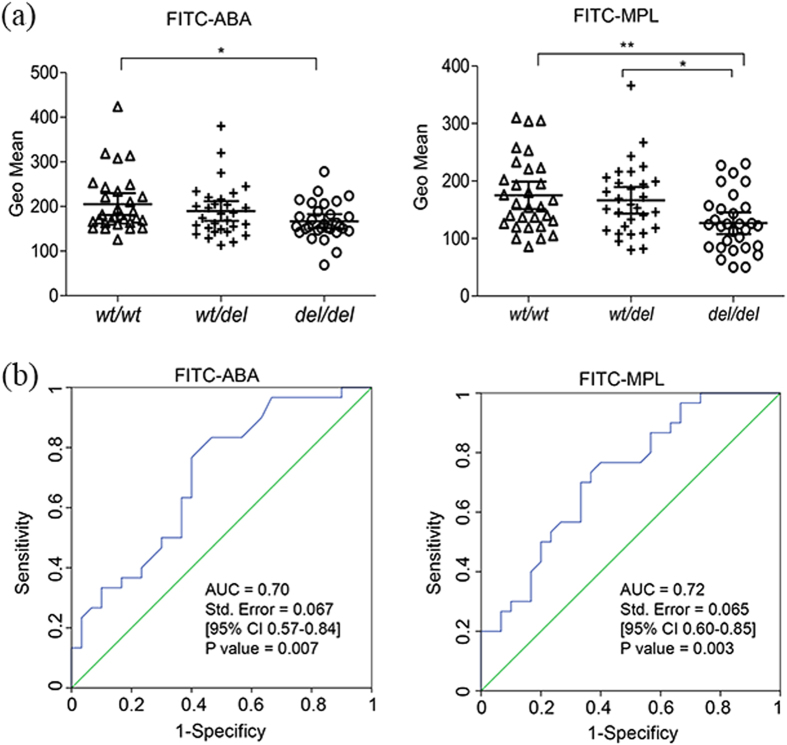
Figure 7. Evaluation of ABA and MPL being biomarker candidates by FACS.
(a) The statistic difference of Lectins (ABA and MPL) verified by FACS showing complete consistency with lectin microarray; Geo Mean of lectins binding sperm with different DEFB126 genotypes (wt/wt, n = 30; wt/del, n = 30; del/del, n = 30) analyzed by SPSS16.0. *P < 0.05, **P < 0.01. (b) The performance of ABA and MPL as biomarkers for assessing the sperm fertility; sperm with wt/wt genotype as the control group (n = 30) and sperm with del/del genotype as mutation group (n = 30). The ROC curves and the corresponding AUCs were calculated by SPSS16.0.

