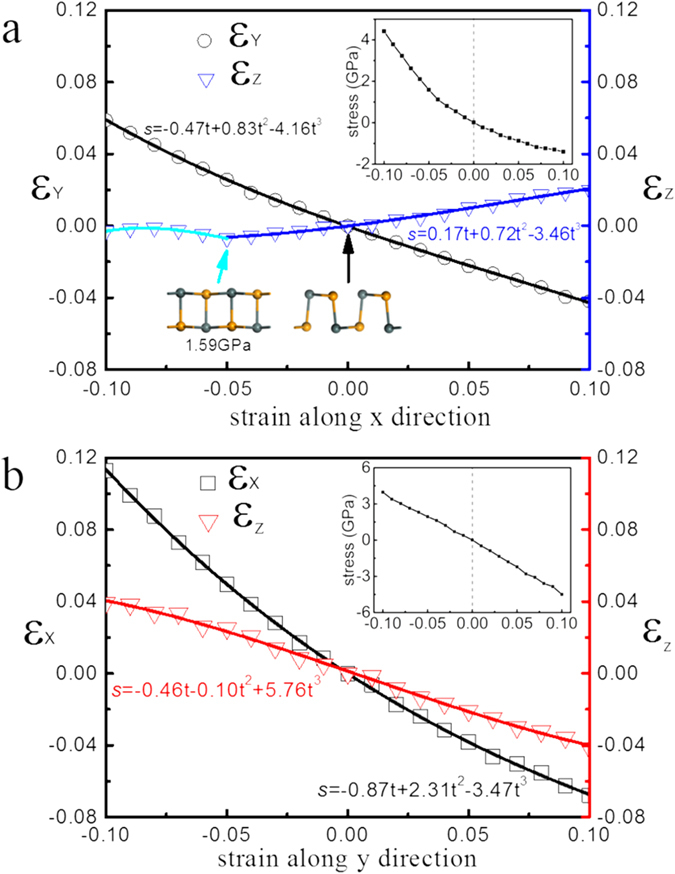
Figure 3. The mechanical response of tinselenidene under uniaxial strain along x (a) and y (b) directions.

Strain is defined as  , where
  represent the lattice parameters (thickness for
  ) along x, y, z directions under strain, respectively, and
  are the corresponding original lattice constants (thickness for
  ) without strain. The positive (or negative) s means a tensile (or compressive) strain, while
  corresponds the case without strain. The Poisson’s ratio can be obtained by fitting
  , where t is the strain along the x or y direction, and
  could be regarded as the Poisson’s ratio. The corresponding stress-strain relations in x and y directions are shown in the upper right insets.
