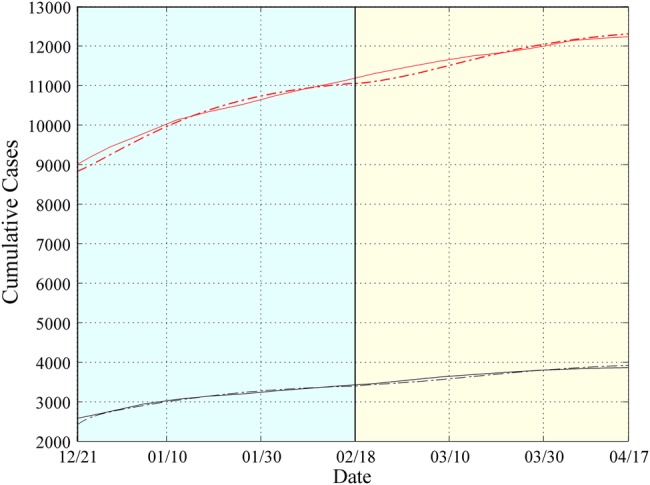
Figure 1.

Simulation Results for Sierra Leone from 21 December 2014 to 17 April 2015. Expected cumulative cases of infected (dotted red) and dead (dotted black). WHO data are depicted by solid lines. The period under study has been tessellated into two windows with a length of 60 days each. For each window, the model parameters are estimated based on the data reported from the WHO.
