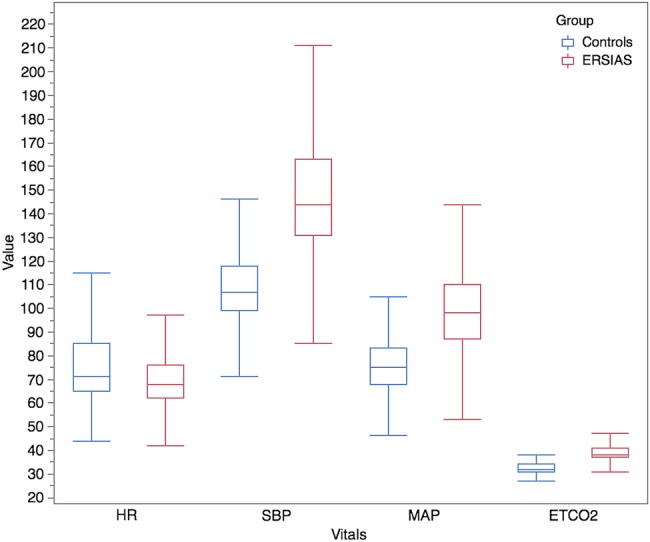
Figure 2.

Box plot of end point vitals per group. Distribution of 3 219 917 data points obtained by minute-to-minute electronic data collection in 24 patients (12 ERSIAS and 12 matched controls). HR, heart rate; ETCO2, end tidal CO2; MAP, mean arterial blood pressure; SBP, systolic blood pressure.
