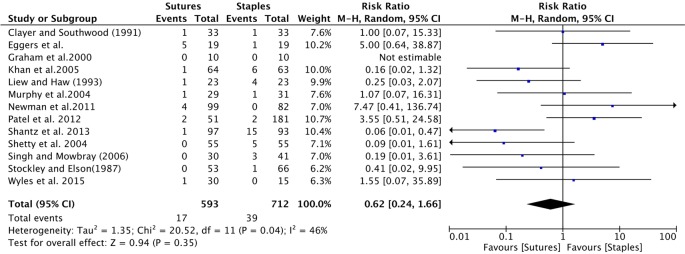
Figure 5.
Forest plot indicating the adjusted relative risk (RR; 95% CI) of infection within scenario 2: all lost to follow-up had infection in the staple group, thus favouring sutures. Original randomised treatment sizes were used for RR calculations. Cumulative effect was calculated using the Mantel-Haenzel random-effects model.

