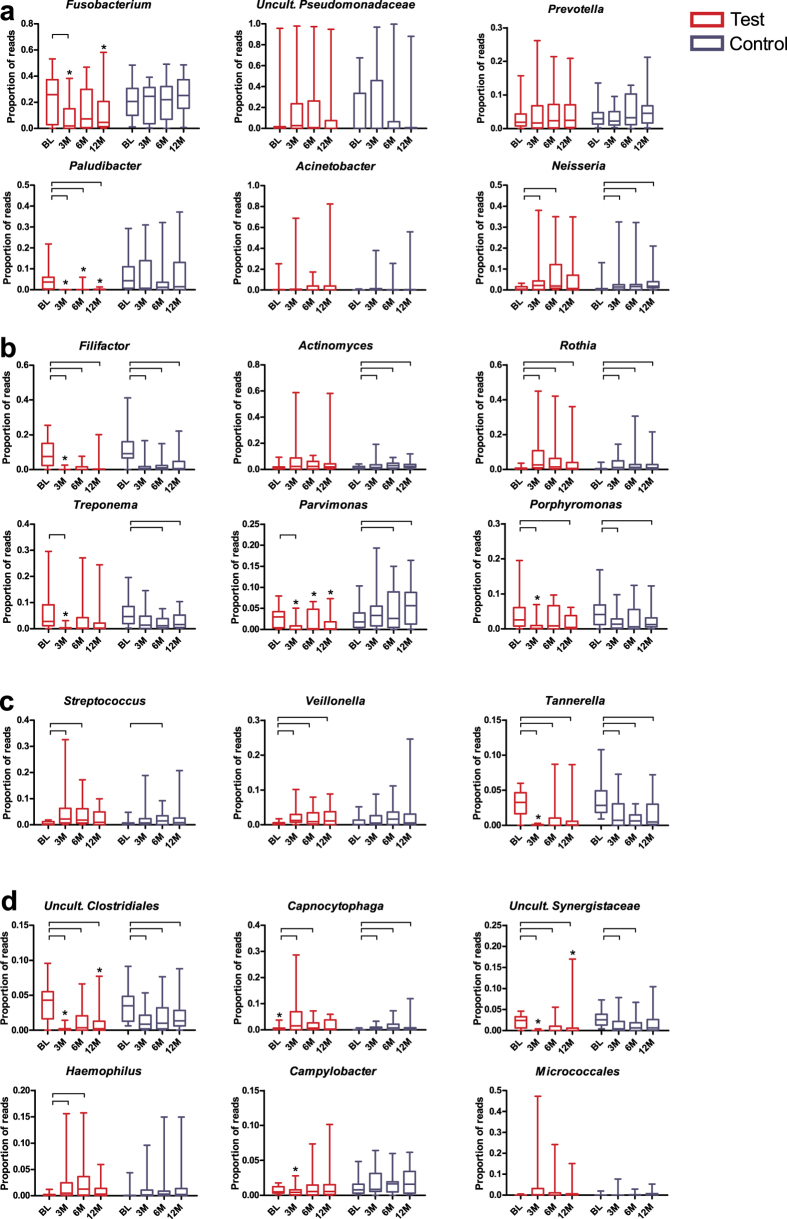
Figure 1. Relative abundances of the major genera or higher taxa.
(a) Taxa that were significantly reduced by both treatments; (b) taxa that increased after the treatments; (c) taxa that were affected only in the Test group and (d) that were minimally affected by any of the treatments, for each time point (BL – baseline, 3M – 3 months, 6M – 6 months, 12M – 12 months) and treatment (Test or Control). *Statistically significant difference between the treatment groups (P < 0.05; Mann-Whitney test). Connectors connect the time-points within the same group in which the taxa proportions differed significantly (P < 0.05, Wilcoxon Signed Ranks test).

