
Figure 3. Average Bray-Curtis similarity of microbiome profiles.
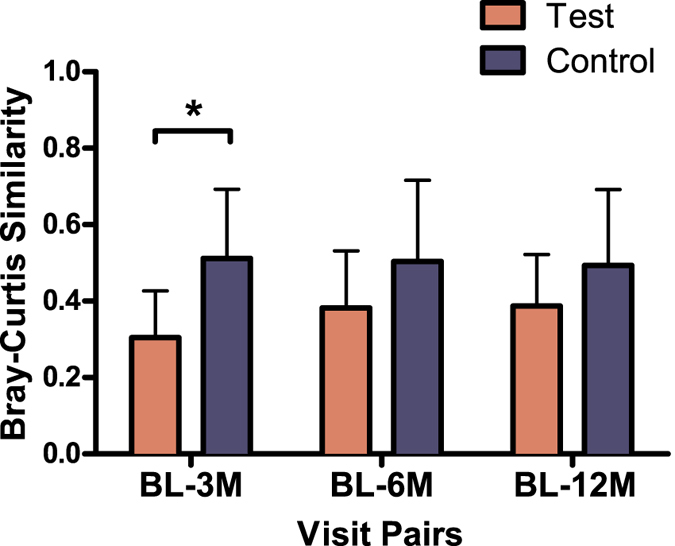
Bars represent differences between the baseline visit (BL) and the other visits (3M – 3 months, 6M – 6 months, 12M – 12 months after therapy) for each individual according to treatment group (Test and Control). Connector indicates statistically significant difference between the groups (P < 0.001, independent samples T-test).