
Figure 4. Correlation between Shannon diversity index at baseline and per cent change of Clinical Attachment Level (% CAL change) of the sampled sites at 12 months.
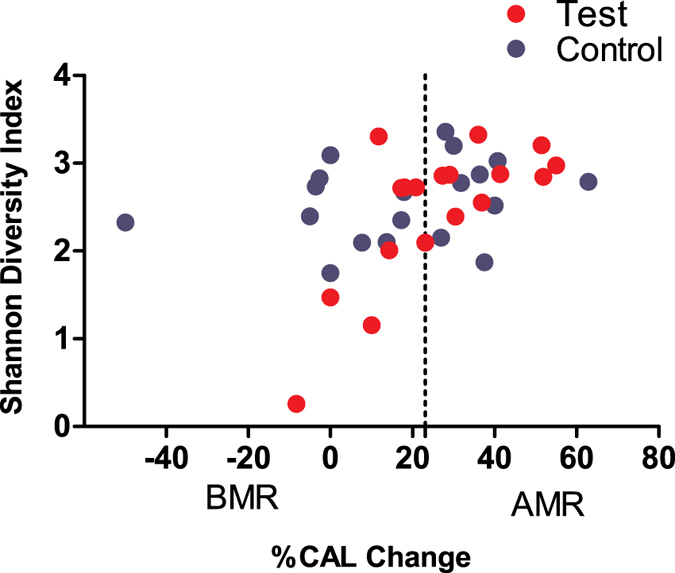
Light coloured dots represent patients in the test group and dark coloured dots represent patients in the control group. The vertical line represents the cut-off point (24.08%) between Below Median Responders (BMRs) and Above Median Responders (AMRs).