
Figure 5. Average Shannon Diversity Index according to treatment modality and treatment outcome.
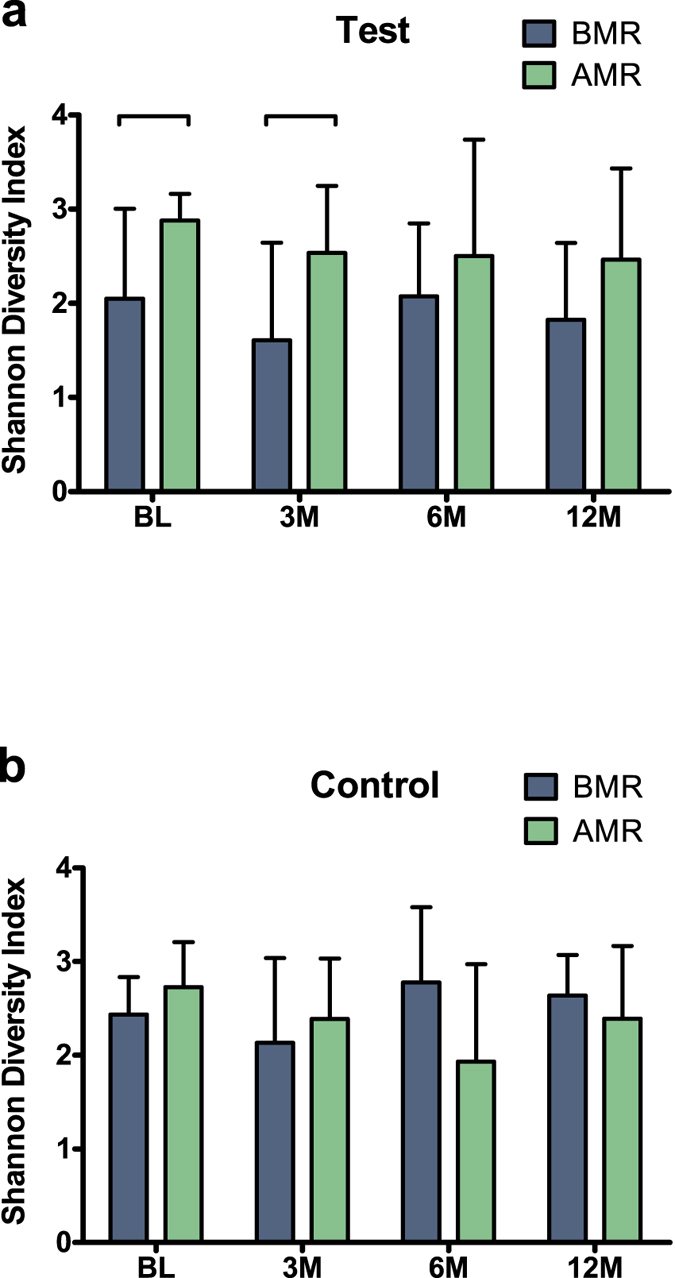
(a) Below Median Responders (BMRs) and Above Median Responders (AMRs) in the Control group and (b) the Test group samples per time point (BL – baseline, 3M – 3 months, 6M – 6 months, 12M – 12 months). The error bars indicate standard deviation. The connector indicates a statistically significant difference (P < 0.05, Independent samples T-test).