
Figure 6. Average Bray-Curtis similarity in microbiome profiles according to treatment modality and treatment outcome.
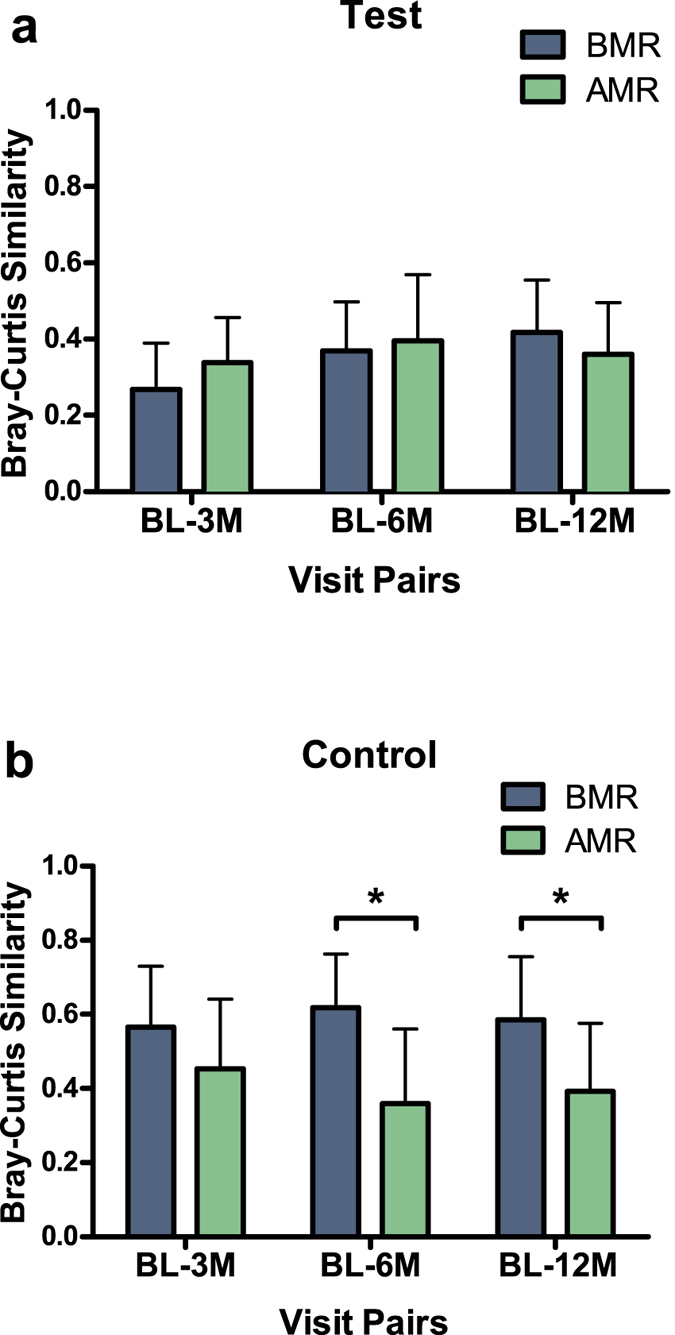
Bars represent differences between the baseline visit (BL) and the other visits (3M – 3 months, 6M – 6 months, 12M – 12 months since the treatment) of each individual by clinical response at one-year follow-up (a) in the Test group and (b) in the Control group. Test: N = 9 Above Median Responders (AMRs), N = 9 Below Median Responders (BMRs); Control group: N = 10 Above Median Responders (AMRs), N = 9 Below Median Responders (BMRs). Error bars indicate standard deviations. Connector indicates a statistically significant difference between the groups (independent samples T-test).