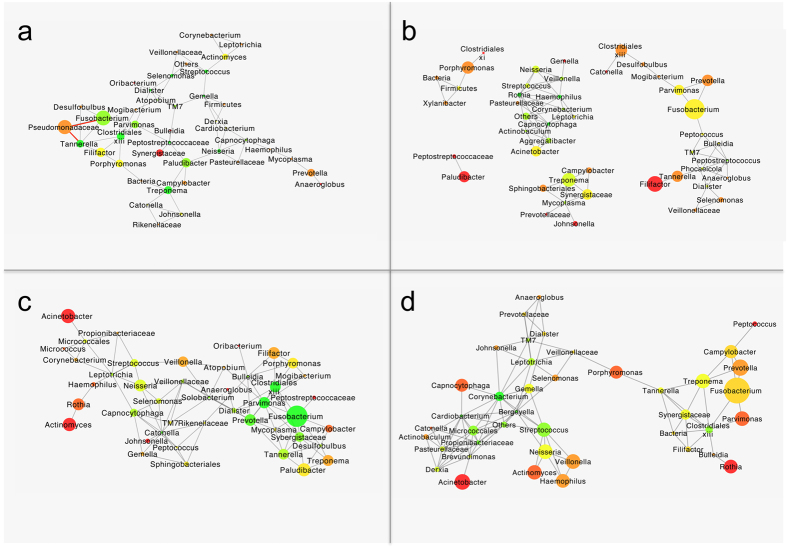
Figure 7. Microbial co-occurrence or mutual exclusion networks between genera.
(a) Baseline taxonomic networks for the below median responders (BMRs) and (b) the above median responders (AMRs). (c) 12-month follow-up taxonomic network for below the median responders (BMRs) and (d) the above median responders (AMRs). Only edges that were significant by at least two of the methods (i.e. Pearson and Spearman correlations, Bray-Curtis similarity and Kullback-Leibler divergence) after correction for multiple comparisons were included in the network. The grey edges indicate positive correlations, and the negative correlations are indicated in red (P < 0.05). The size of the node is indicative of the relative abundance of the respective taxon. The colour of the node indicates the number of connections in the range of red to green; red indicates one connection, while green indicates >3 connections.

