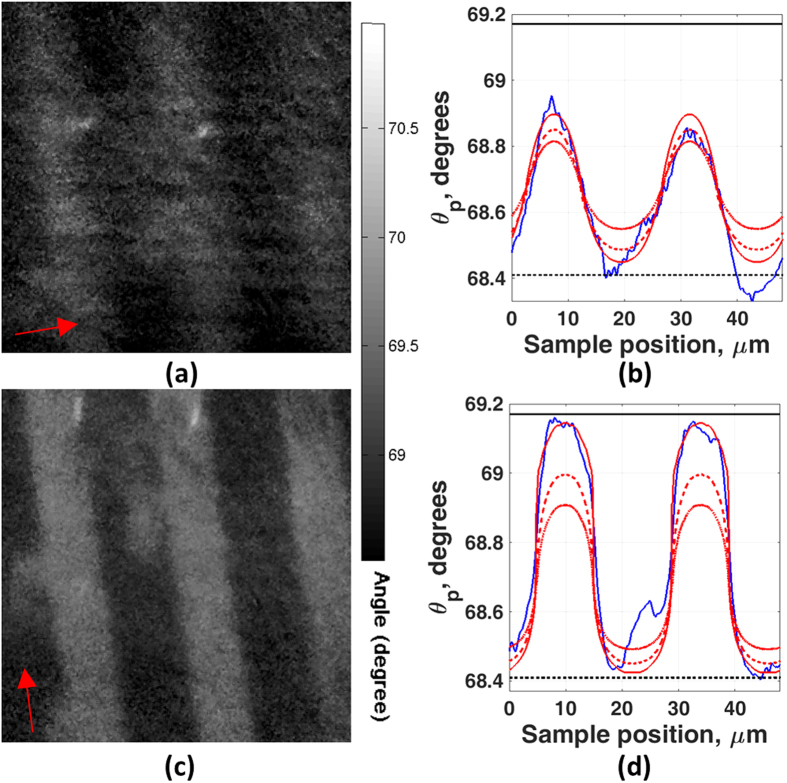
Figure 5. Images of BSA grating sample with different incident light polarization.
The field of view is 70 μm × 70 μm, the period of grating is 24 μm. (a) Grating vector parallel to incident polarization direction and the sample exposed in the water (arrow indicates nominal polarization direction). (b) Linescan image of case (a) compared with simulation result. (c) Grating vector perpendicular to incident polarization direction and the sample exposed in the water (arrow indicates nominal polarization direction). (d) Linescan image of case (c) compared with simulation result. The black line and the dotted black line represent uniform layer of 14 nm thick of BSA coated on uniform gold and bare gold case respectively. The blue curve shows experimental linescan image. The dotted-dash red, dotted red and red curves represent the simulation results where the sample was BSA grating with 10 nm, 12 nm and 14 nm thick respectively.

