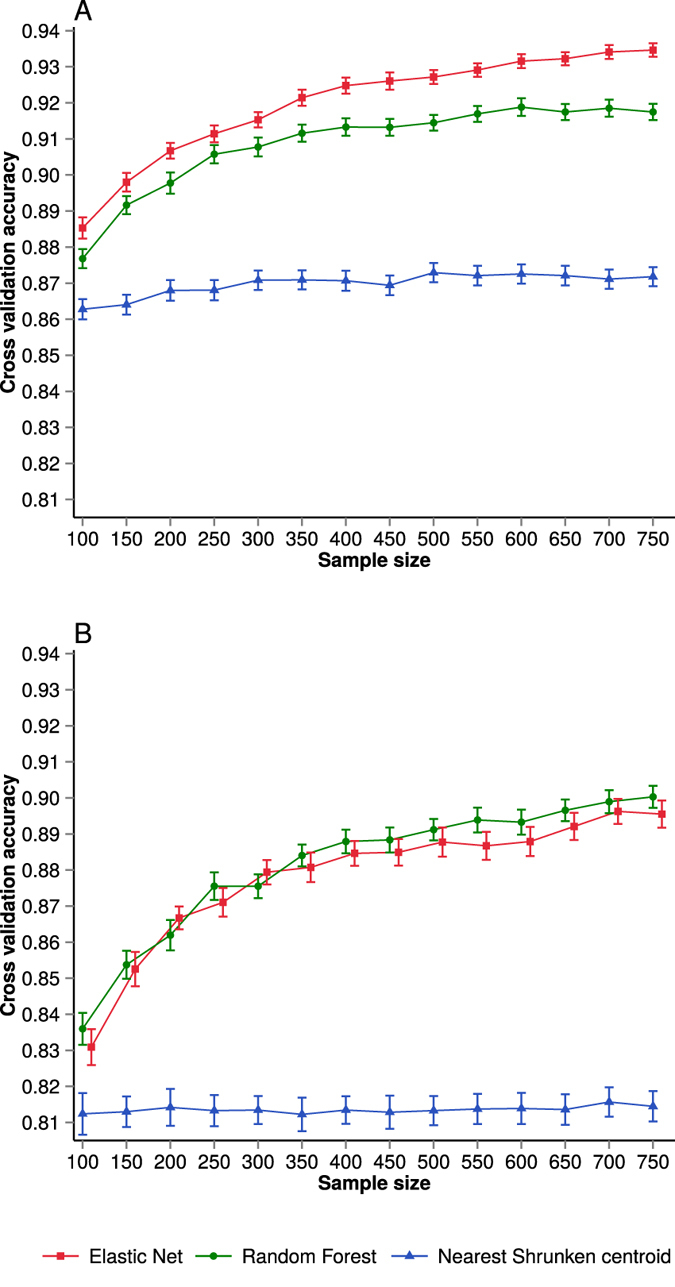
Figure 1. Subtype classification accuracy (nested cross-validation) as a function of training dataset sample size.

Subtype classification accuracy (A) for the PAM50 data set and (B) for the Top25 dataset. Performances of different classifiers are indicated by distinct colours. For the purpose of visualisation, Elastic net data points in (B) have been shifted slightly to the right. Error bars represent standard error of the cross-validation mean.
