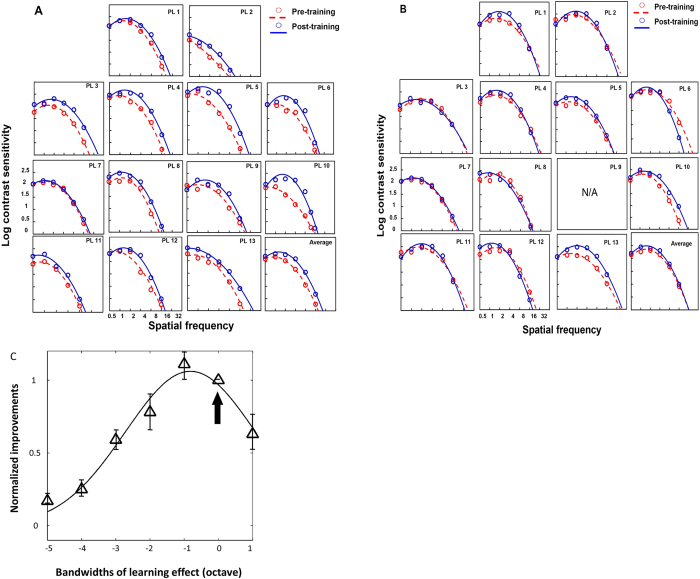
Figure 4.
Contrast sensitivity functions before and after perceptual learning in (A) the amblyopic eyes; (B) the non-amblyopic eyes, group average fitting is show in the last graph. (C) Bandwidth of perceptual learning in the amblyopic eye. Only data from participants who trained at a single spatial frequency was analysis. Arrow indicating trained spatial frequency. Error bars stand for ±S.E.M.

