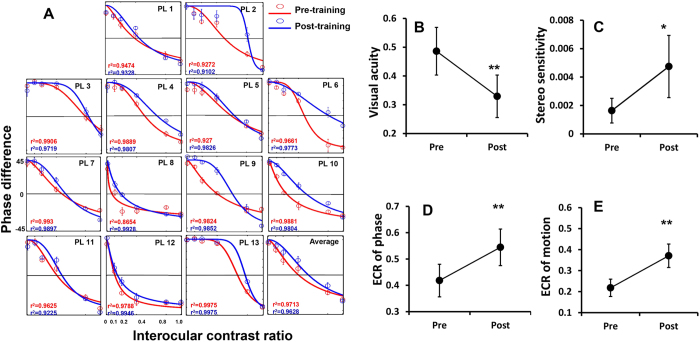
Figure 5.
Binocular phase combination before and after treatment: (A) individual fits with Huang’s model (2009). Solid lines represent the best fitted curves according to the model. Red and blue lines stand for the measurements before and after treatment, respectively. ECRs are indicated where the curves cross the line of zero. Group average fitting is shown in the last graph. (B–E) Summary of visual functions before and after training. (B) visual acuity, (C) stereo-sensitivity; (D) ECR of binocular phase combination and (E) ECR of dichoptic motion coherence. The asterisks indicate significance level. *p < 0.05; **p < 0.01.

