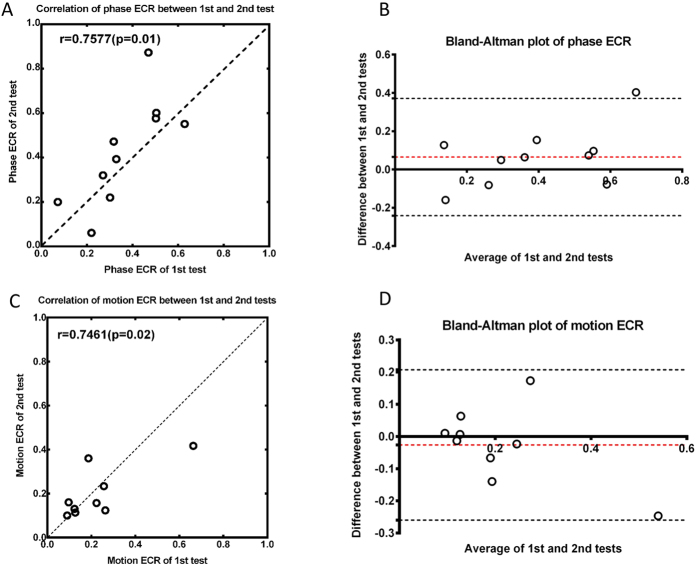
Figure 6. Test-retest reliability of the binocular function measurements.
(A,C) correlation between 1st and 2nd tests of (A) binocular phase combination and (C) dichoptic motion coherence. The dotted line represents the line of equality. (B,D) plots of difference of ECR between 1st and 2nd tests against the average of them for (B) binocular phase combination and (D) dichoptic motion coherence. Red dot line: the bias of the test; black dot line: 95% limits of agreement.

