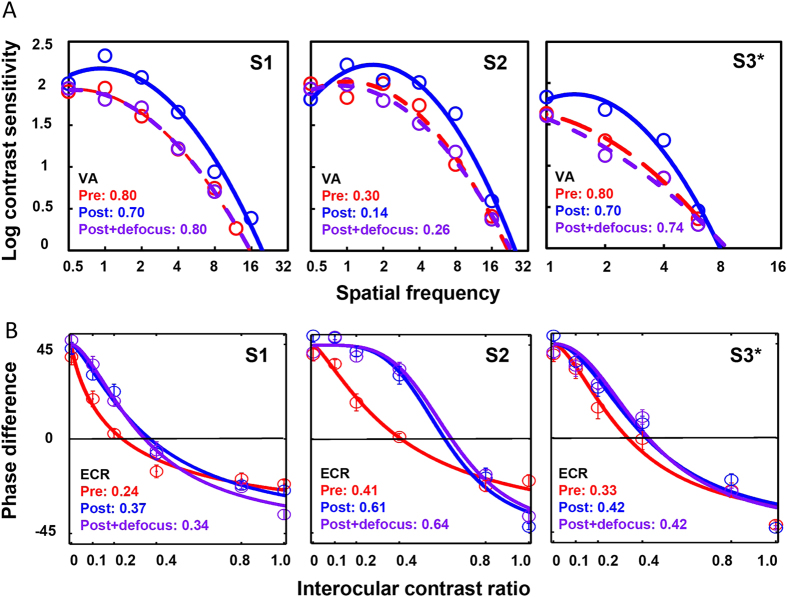
Figure 9.
(A) CSFs of three participants before (red dashed line), after (blue solid line) training and after training + defocus (purple dashed line). The over-corrected lens was carefully selected so that the measurements of VA and CSF were comparable with pre-training data (details could be found in SI Table S3). (B) ECR of the phase combination in the same participants under the same condition. Noted that phase combination remained the same even the CSFs were degraded by optical defocus to the pre-training level. *indicated that S3 was trained and measured with tilted gratings +/–5 degree deviated from horizontal orientation instead of a pair of orthogonal ones.

