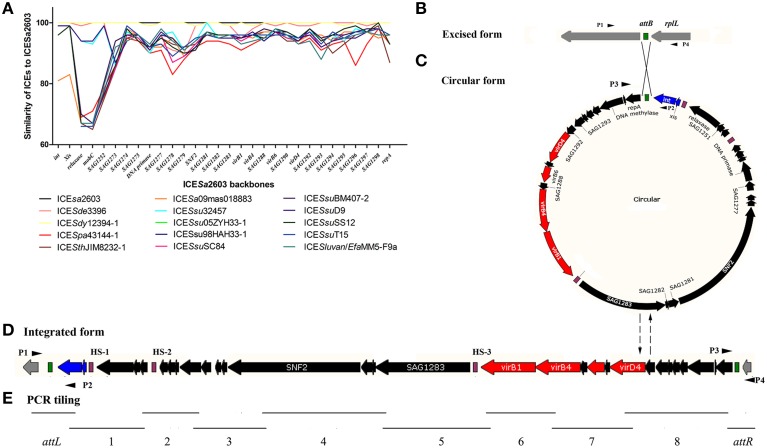
Figure 1.
Core genes identity (%) of the ICESa2603 family and schematic diagram of the integration and excision forms. The attB (B), attICE (C), attL, and attR (D) sites are shown as green rectangles. The core genes are shown by navy (int and xis), red (T4SS genes), and black (other core genes). The HS sites are shown as purple rectangles. (A); Core genes identity (%) of each ICE of ICESa2603 family to that of ICESa2603. (B–D); Schematic diagram of the integration and excision forms of the ICESa2603 family. (E); Schematic diagram of PCR tiling to detect the presence of ICEs fragments.

