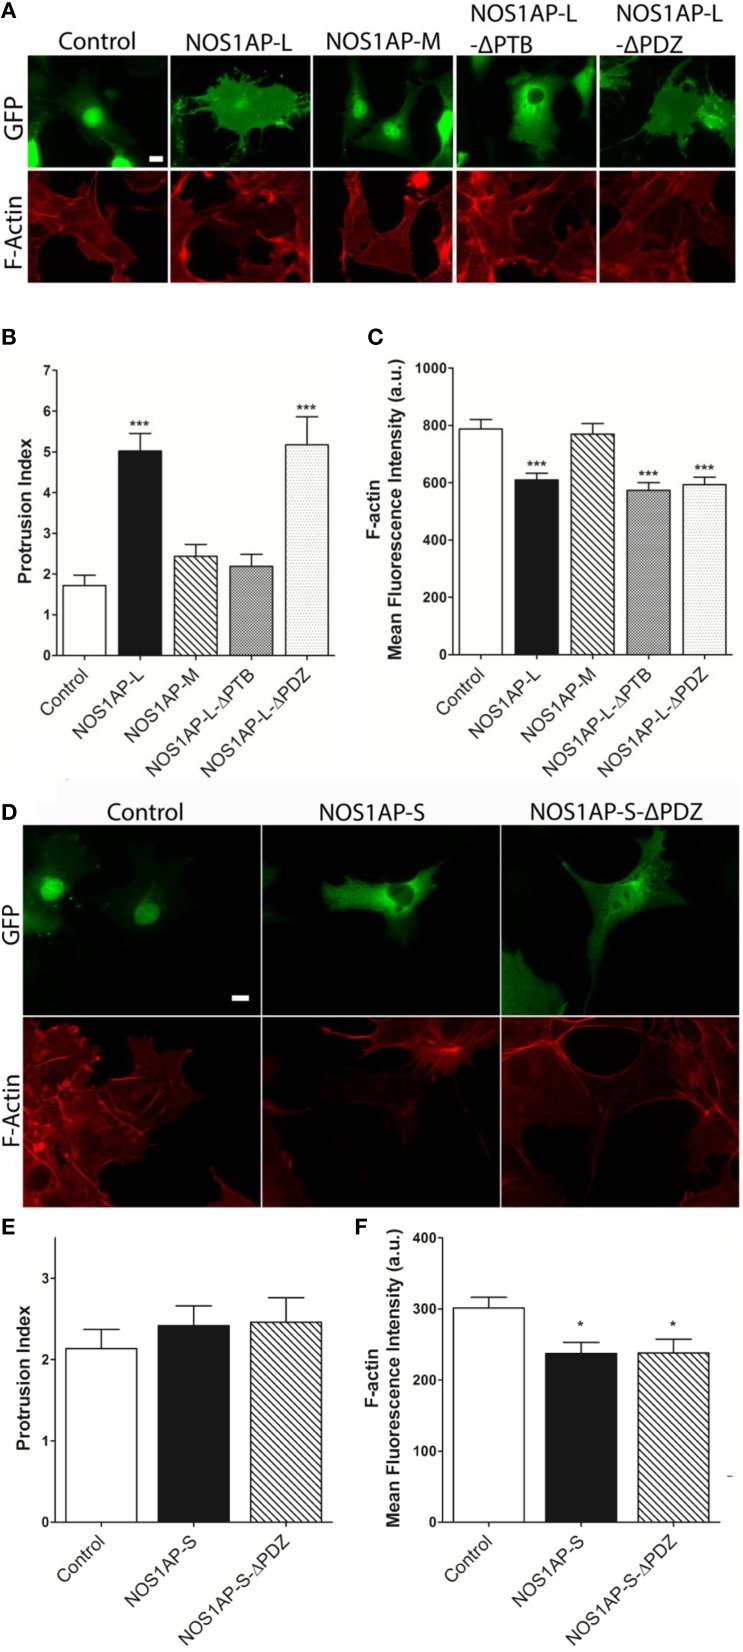
Figure 2.
Effects of NOS1AP-L or NOS1AP-S overexpression on protrusion index and F-actin. (A) Representative images of Alexa Fluor® 647 phalloidin staining of cells expressing GFP (Control), NOS1AP-L, NOS1AP-M, NOS1AP-L-ΔPTB, or NOS1AP-ΔPDZ. (B) Quantitation of protrusion indices from COS-7 cells 48 h after transfection with plasmids encoding the indicated proteins. ***p < 0.001 vs. control. p-values were determined by one-way ANOVA followed by Dunnett's Multiple Comparisons test. Error bars indicate ± s.e.m from three experiments. n = 10 cells, GFP; n = 16, NOS1AP-L; n = 12, NOS1AP-S; n = 10, NOS1AP-M; n = 14, NOS1AP-L-ΔPTB; n = 11, NOS1AP-ΔPDZ. (C) Intracellular F-actin content determined by Alexa Fluor® 647 phalloidin fluorescence intensity 48 h after transfection of COS-7 cells with plasmids encoding the indicated proteins. ***p < 0.001 vs. Control. p-values were determined by one-way ANOVA followed by Dunnett's Multiple Comparisons test. Error bars indicate ± s.e.m from three experiments. n = 36 cells, GFP; n = 36, NOS1AP-L; n = 36, NOS1AP-S; n = 36, NOS1AP-M; n = 34, NOS1AP-L-ΔPTB; n = 35, NOS1AP-ΔPDZ. Scale bar = 10 μm. (D) Representative images of Alexa Fluor® 647 phalloidin staining of cells expressing GFP (Control), NOS1AP-S, or NOS1AP-S-ΔPDZ. (E) Quantitation of protrusion indices from COS-7 cells 48 h after transfection with plasmids encoding the indicated proteins. Error bars indicate ± s.e.m from three experiments. n = 31 cells, GFP; n = 34, NOS1AP-S; n = 32, NOS1AP-S-ΔPDZ. (F) Intracellular F-actin content determined by Alexa Fluor® 647 phalloidin fluorescence intensity 48 h after transfection of COS-7 cells with plasmids encoding the indicated proteins. *p < 0.05 vs. Control. p-values were determined by one-way ANOVA followed by Dunnett's Multiple Comparisons test. Error bars indicate ± s.e.m from three experiments. n = 68 cells, GFP; n = 49, NOS1AP-S; n = 55, NOS1AP-S-ΔPDZ.

