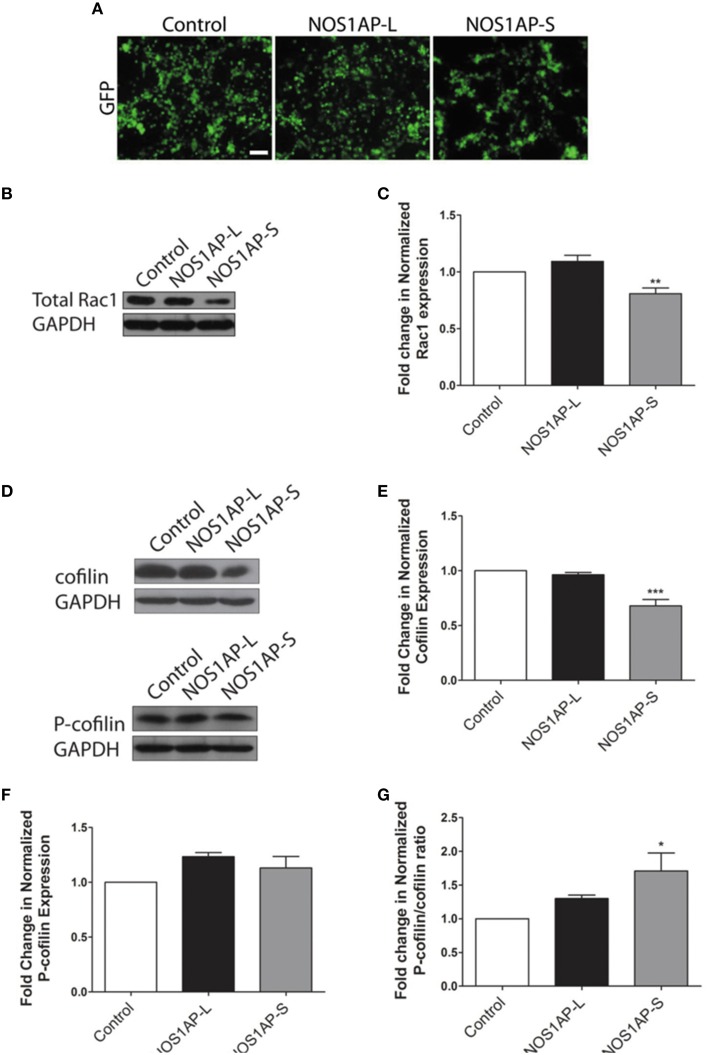
Figure 3.
NOS1AP-S decreases total Rac1 and cofilin protein expression in HEK293T cells. (A) Representative images of HEK293T cells expressing GFP (control), GFP-NOS1AP-L, or GFP-NOS1AP-S. Scale bar = 100 μm. (B) Lysates from cultures of transfected HEK293T cells expressing GFP (control), NOS1AP-L, or NOS1AP-S were resolved by SDS-PAGE and analyzed by Western blotting using antibodies that recognize Rac1 and GAPDH to determine total Rac1 protein levels. Representative blot is shown. (C) Relative quantification of Rac1 normalized to control from multiple blots represented in (B). Error bars indicate ± s.e.m. n = 9 for all conditions. (D) Lysates from cultures of transfected HEK293T cells (different than those in A) expressing GFP (control), NOS1AP-L, or NOS1AP-S were resolved by SDS-PAGE and analyzed by Western blotting using antibodies that recognize cofilin, phosphorylated cofilin (P-cofilin), and GAPDH. Representative blots are shown. (E) Relative quantification of total cofilin normalized to control from multiple blots represented in (D). Error bars indicate ± s.e.m. n = 4 for all conditions. (F) Relative quantification of P-cofilin normalized to control from multiple blots represented in (D). Error bars indicate ± s.e.m. n = 4 for all conditions. (G) Relative quantification of normalized P-cofilin/cofilin ratio from multiple blots represented in (D). Error bars indicate ± s.e.m. n = 4 for all conditions. All analyses were performed by first normalizing to GAPDH as an internal loading control and then comparing experimental condition to GFP control condition. *p < 0.05, **p < 0.01, and ***p < 0.001 vs. control. p-values were determined by one-way ANOVA followed by Dunnett's Multiple Comparisons test.

