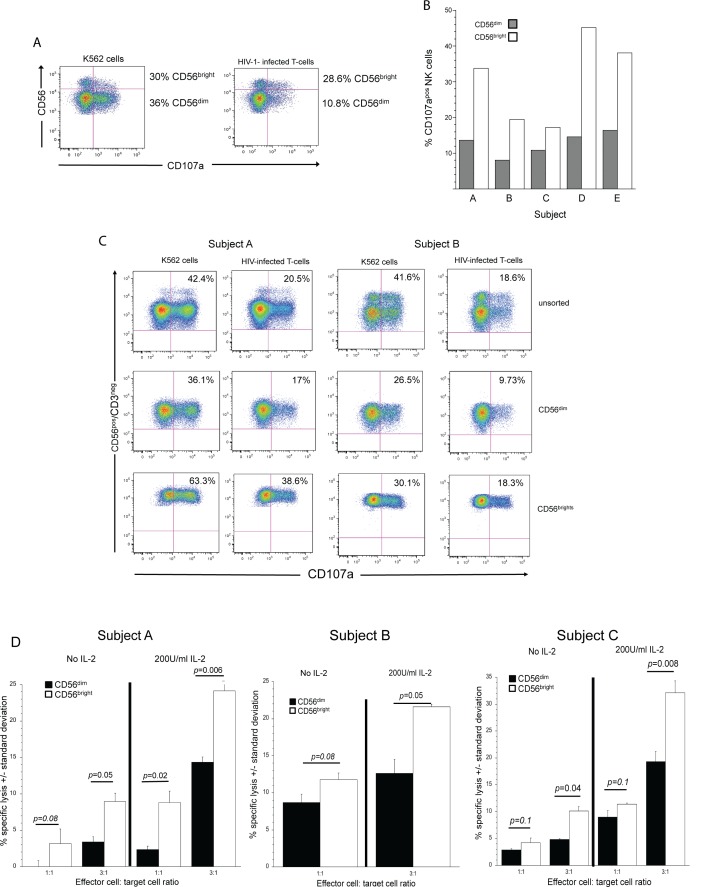
Fig 3. CD56bright NK cells lyse autologous HIV-infected T-cells to a greater extent than CD56dim NK cells.
(A) An example of an experiment (from data presented in Fig 3B) to determine if CD107a is expressed on NK cell subsets expressing relatively high (CD56bright) or low (CD56dim) levels of CD56 when exposed to K562 cells or HIV-infected T-cells. Bold numbers to the right of the figures are percent of CD56bright (upper quadrants) and CD56dim (lower quadrants) NK cells that express CD107a on their surface after 4-hour exposure to target cells. (B) Percent of CD107a positive CD56dim (black bars) and CD56bright (white bars) NK cells from five subjects after exposure to autologous HIV-infected cells. (C) Ability of unsorted NK cells, sorted CD56dim NK cells and sorted CD56bright NK cells from two different donors (subjects A and B) to degranulate in response to K562 cells or HIV-infected T-cells. The HLA genotype for subject A was A*0201/A*1101 B*0702 (HLA-Bw6) /B*5601 (HLA-Bw6) and Cw*0102 (C1)/Cw*0401(C2). The HLA genotype for subject B was A*2901/A*1101 B*4403 (HLA-Bw4)/B*5101 (HLA-Bw4) and Cw*1502 (C2)/Cw*1601 (C1). Numbers in each plot represent the percent of CD107a+ NK cells of unfractionated, sorted CD56dim or sorted CD56bright NK cells after exposure to target cells. (D) Percent specific lysis of HIV-1 infected T-cells by sorted CD56dim (black bars) and sorted CD56bright (white bars) NK cells from three donors cultured overnight without or with 200 U/ml of IL-2. Error bars represent standard deviations of percent specific lysis of three replicates. The HLA genotype for the first subject was A*0201/A*1101, B*0702 (HLA-Bw6) /B*5601 (HLA-Bw6) and Cw*0102 (C1) /Cw*0401 (C2). The HLA genotype for the second subject was A*0101/A*2901, B*0801 (HAL-Bw6)/B*4403 (HLA-Bw4) and Cw*0701 (C1)/Cw*1601(C1). The HLA genotype for the third subject was A*1101/A*3101, B*5101 (HLA-Bw4)/B*4001 (HLA-Bw6) and Cw*0304 (C1)/Cw*1402 (C1). Numbers over bars between columns indicate p-values based on Mann-Whitney U-tests. p≤0.05 was considered statistically significant.

