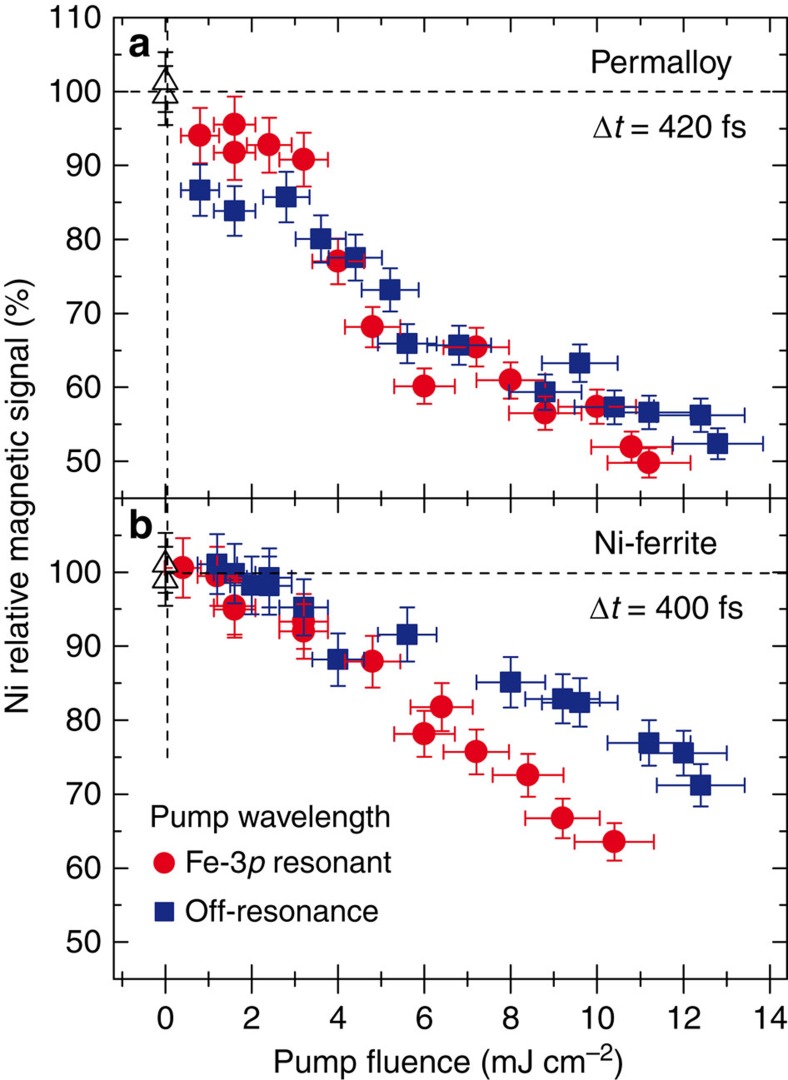
Figure 6. Resonant versus non-resonant pumping.
Pump fluence dependence of the Ni demagnetization in permalloy (a) and Ni-ferrite (b) at ∼400 fs delay, comparing the results for Fe-3p resonant (λFEL_2=23.2 nm, red circles) and non-resonant (λFEL_2=25.5 nm, blue squares) FEL pump pulses. The Ni magnetic signal is reported as the asymmetry ratio in the Bragg peak intensity, normalized to the value measured with no pump (open triangles). Error bars represent s.d. (see Methods).

