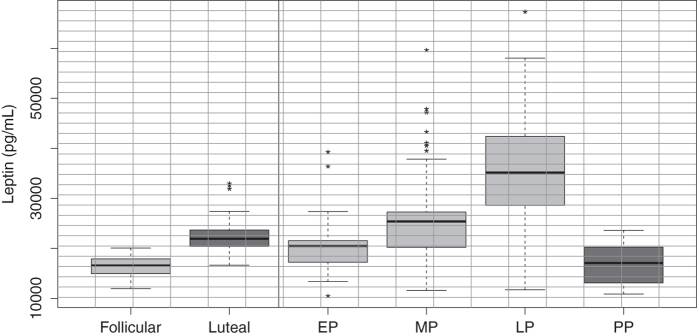
Figure 3. Serum leptin levels during pregnancy, three months postpartum and non-pregnant women during both the follicular and luteal phase.
Box-and-whisker plot with median value, interquartile range, and lower and upper values. Significant differences were observed between the follicular and luteal phase. A significant increase in serum leptin levels was observed across normal pregnancy compared with healthy non-pregnant women and three months postpartum. EP = early pregnancy, MP = middle pregnancy, LP = late pregnancy, PP = postpartum. The statistical significance is indicated by *p < 0.05and ***p < 0.001.

