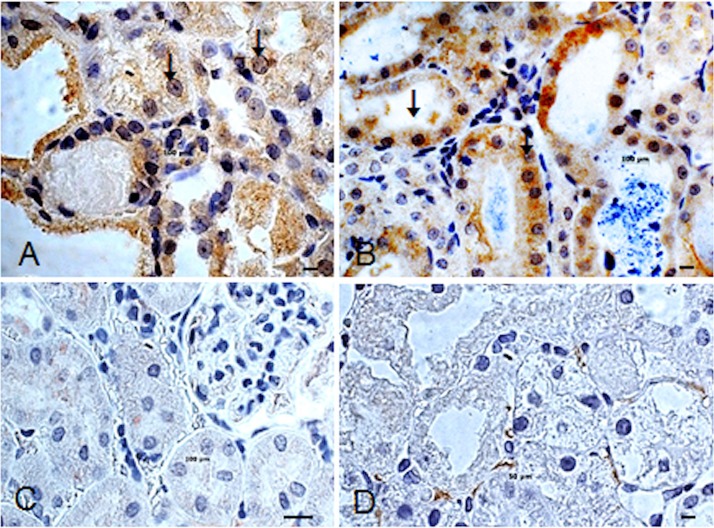
Figure 6.
Effect of IDPSC transplantation on kidney cell proliferation. Ki-67 immunoreactivity observed after IP (A) and EV (B) IDPSC administration in groups B2 and B3, respectively. (C and D) Control animals from groups A and B1, respectively, are shown. Both showed either a little (D, intertubular cells) or no immunoreactivity with Ki-67 antibody. Arrows in (A) and (B) indicate Ki-67 antigen nuclear localization (brown). Light microscopy. Scale bars: 10 µm (A–D).

