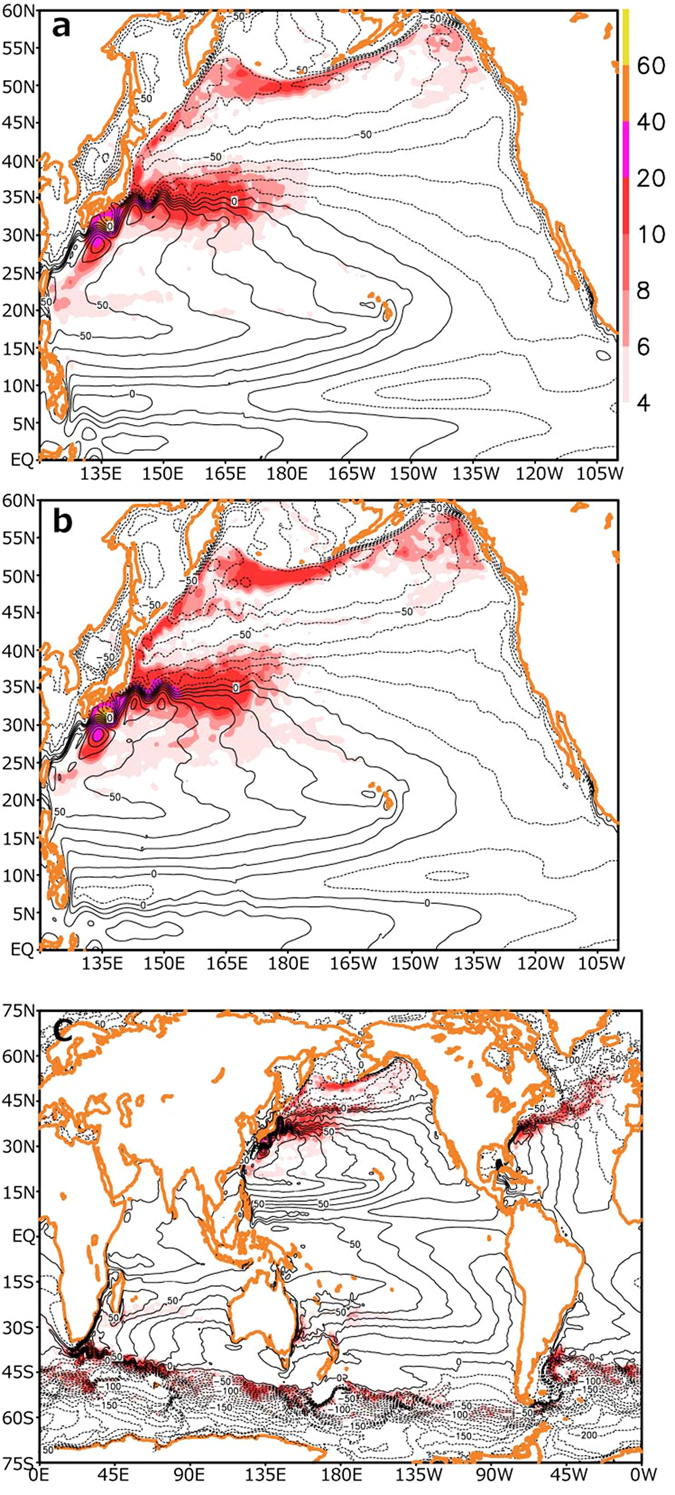
Figure 3. Uncertainty in sea-surface height (SSH) field.

(a) Map of root-mean-square differences in 13-month running-mean SSHAs among the three ensemble members. Contours indicate the long-term mean SSH field with intervals of 10 cm. (b) Standard deviations of SSH for the climatological integration. (c) Same as (b) but for the quasi-global model integration. For every plot, unit is cm. All plots are generated with GrADS.
