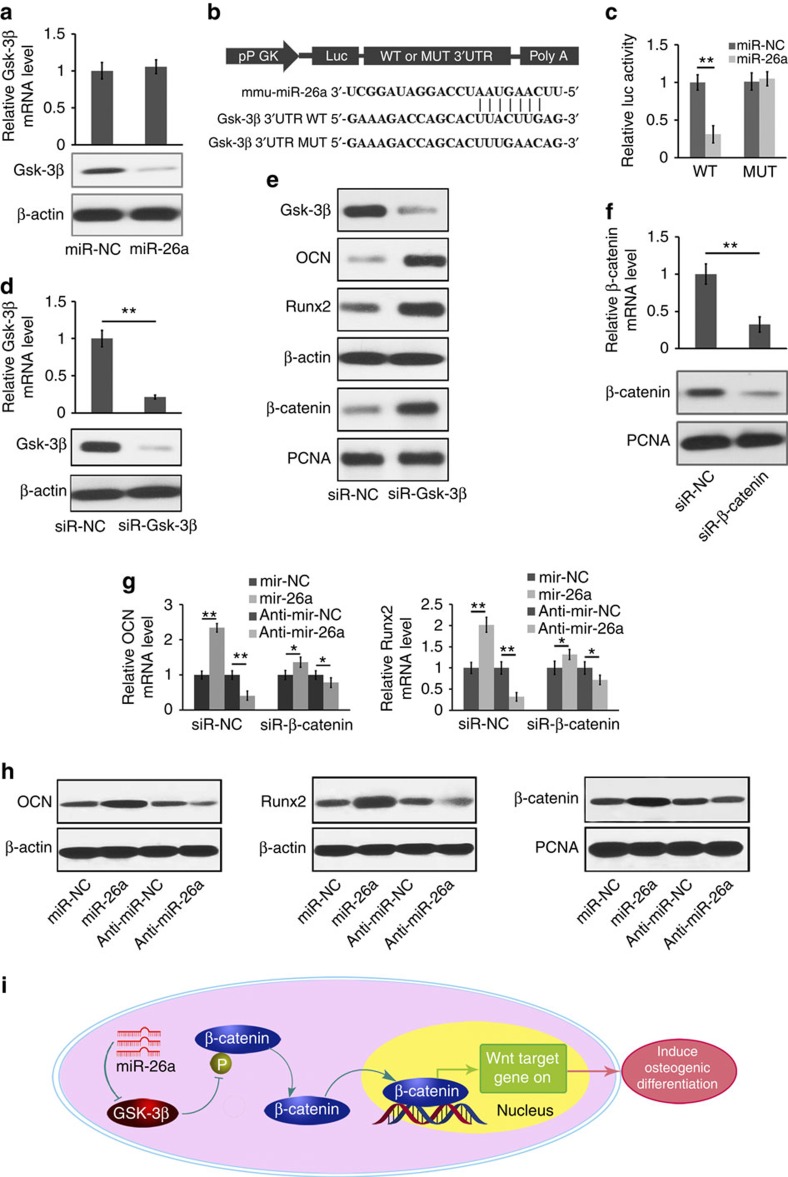
Figure 8. miR-26a targets Gsk-3β to functionally enhance osteoblast activity.
(a) The effect of miR-26a, its NC (miR-NC) on Gsk-3β mRNA expression (top) and Gsk-3β protein level (bottom) in mouse primary osteoblast cells. (b) Schematic diagram illustrating the design of luciferase reporters with the WT Gsk-3β 3′UTR (Gsk-3β-3′UTR WT) or the site-directed mutant Gsk-3β 3′UTR (Gsk-3β-3′UTR mutated (MUT)). (c) The effect of miR-NC, miR-26a on luciferase activity in osteoblast cells transfected with either the Gsk-3β-3′UTR WT or the Gsk-3β-3′UTR MUT. (d) The Gsk-3β mRNA expression (top) and the amounts of Gsk-3β protein (bottom) in mouse primary osteoblasts after silencing Gsk-3β with a Gsk-3β-specific siRNA (siR-Gsk-3β). (e) The western blot analysis of Runx2, OCN and β-catenin protein in mouse primary osteoblasts after treatment with siR-Gsk-3β or its NC (siR-NC) in osteogenic medium for 7 days. (f) The β-catenin mRNA expression (top) and the β-catenin protein content (bottom) in mouse primary osteoblasts after silencing β-catenin with a β-catenin-specific siRNA (siR-β-catenin). (g) Real-time RT–PCR analysis of Runx2 and OCN mRNA levels in mouse primary osteoblast cells after silencing β-catenin with siR-β-catenin under the treatment of miR-26a or anti-miR-26a or their corresponding NCs. (h) The western blot analysis of Runx2, OCN and β-catenin protein contents in mouse primary osteoblasts after treatment with miR-26a or anti-miR-26a or their corresponding NCs. (i) Schematic diagram of miR-26a-mediated osteoblast activity by modulating Gsk-3β/β-catenin signalling pathway in osteoblasts. Intracellular Gsk-3β level was downregulated by miR-26a. Subsequently, β-catenin phosphorylation by Gsk-3β was repressed in response to reduced Gsk-3β expression, and therefore the stabilization, accumulation and translocation of β-catenin from the cytoplasm to the nucleus to promote the transcription, which resulted in the induction of osteogenic differentiation. *P<0.05; **P<0.01. All experiments were performed in triplicate. n=5 per group. Data are mean±s.d. The full scans of blots in this figure are provided in Supplementary Fig. 24.

