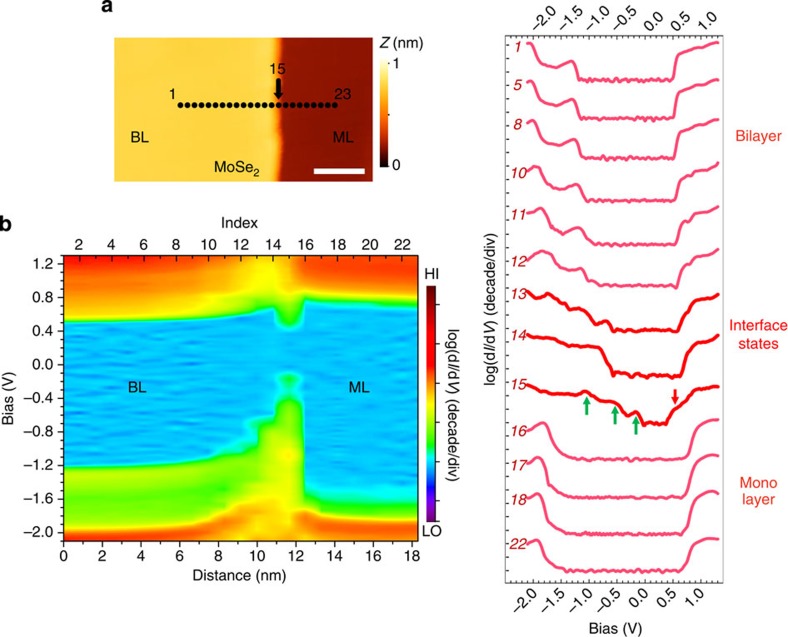
Figure 3. Scanning tunnelling spectroscopy investigation of band profile across the BL–ML MoSe2 heterojunction.
Similar with Fig. 2, (a) is a close-up STM image showing the path line that spectroscopy was taken along. The total length is about 18 nm with a step size of 0.8 nm. The spectra numbers in b and c are counted from left to right in the path, while spectrum #15 was taken right at the BL–ML interface. (b) Colour-coded rendering of the real space imaging of band profile plotted in terms of log(dI/dV). (c) Selective subset of log(dI/dV) spectra. In spectrum #15, the interface states in valence band and conduction band are marked with green and red arrows, respectively. Scale bar, 5 nm (a).

