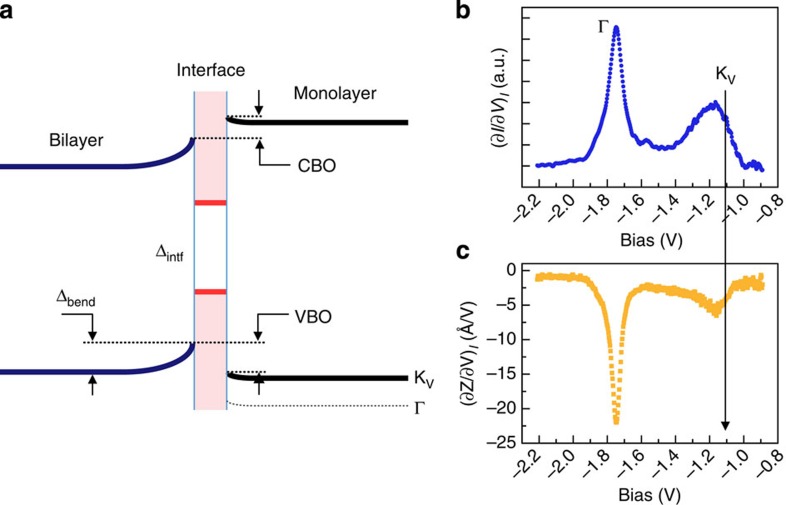
Figure 4. Schematic diagram of band alignments and constant Z spectroscopy for valence band of ML WSe2.
(a) Schematic diagram showing the generic band alignment in BL–ML TMDs HJs. The magnitude of the band bending is labelled as Δbend, and the gap of interface states is Δintf. (b,c) Two modes of constant Z spectroscopy—(∂I/∂V)I and (∂Z/∂V)I for valence band of monolayer WSe2. The actual valence band maximum at K point is labelled as KV, which is about 0.65 eV above Γ point. See ref. 29 for details.

