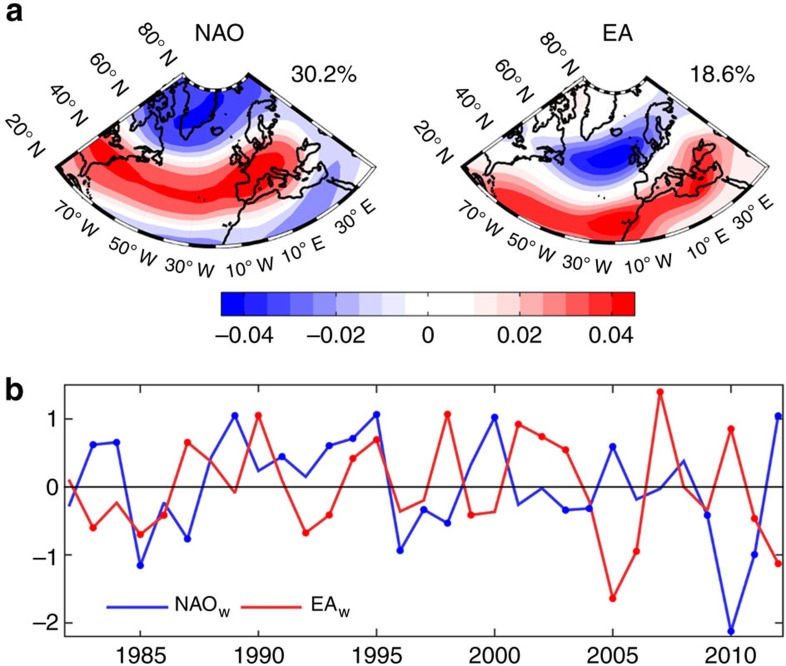
Figure 1. Main large-scale atmospheric circulation patterns in Europe.
(a) Spatial patterns of the two first components of 500 mb geopotential height (from NCEP/DOEII Reanalysis) variability over the North-Atlantic: NAO and EA teleconnections. (b) Time series of the winter composites of NAO (blue line) and EA (red line) from NOAA; circle markers indicate the positive and negative phases of each mode, defined by the upper and lower tercile thresholds (Supplementary Table 3).

