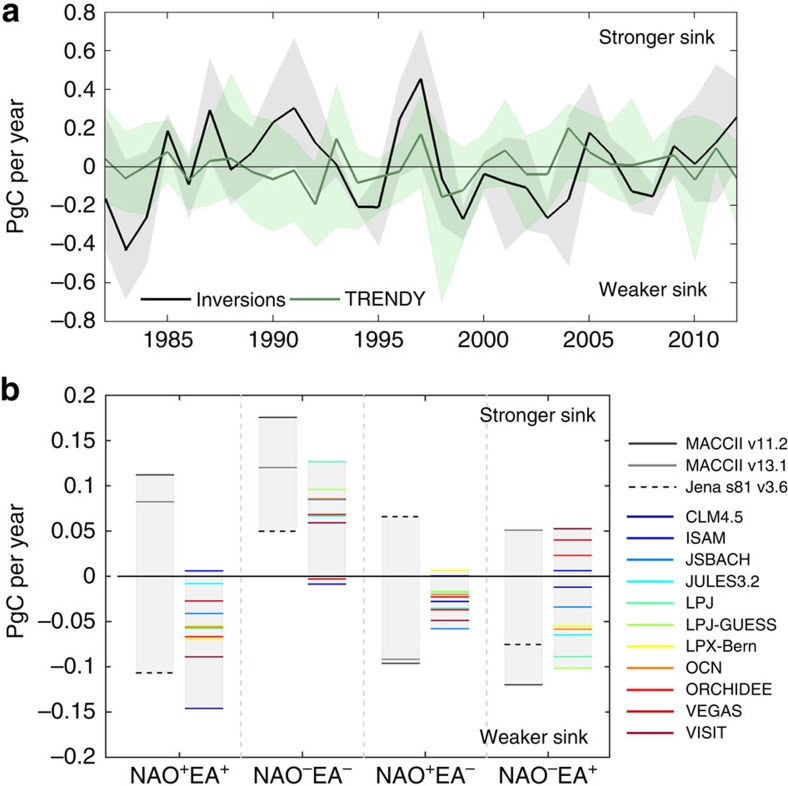
Figure 2. Impact of NAO–EA variability on NBP.
(a) Annual NBP anomalies integrated over Europe (bold lines) and corresponding spread, that is, the minimum and maximum NBP estimated by each set (shaded area), for the atmospheric transport model inversions (black) and the DGVMs from TRENDY project (green). (b) Average European NBP anomalies for the four NAO–EA composites (Supplementary Table 3), assessed by inversions (greyscale lines) and DGVMs (colour lines).

