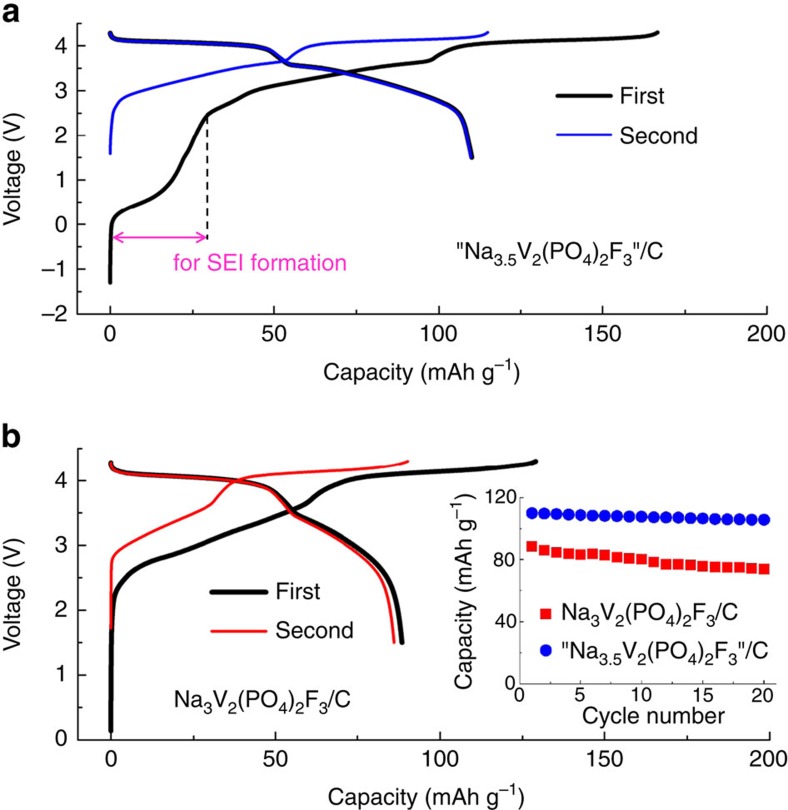
Figure 6. Performances of C/‘Na3+xV2(PO4)2F3' Na-ion cells.
The voltage-composition profiles are reported for two first cycles for cell C1 using Na3V2(PO4)2F3 (b) and cell C2 using ‘Na3.5V2(PO4)2F3' (a). The weight ratio of cathode to anode is 2.7 and 1.9 for C1 and C2 cell, respectively. The cells were cycled at a 0.2C rate (C rate being defined as the extraction of 2 Na from NVPF). For both cells a 1 M NaClO4 in EC/DMC (50/50 by volume) electrolyte was used. The capacity is calculated based on the weight of positive materials. Inset in (b) shows the capacity retention in the first 20 cycles.

