
FIGURE 8.
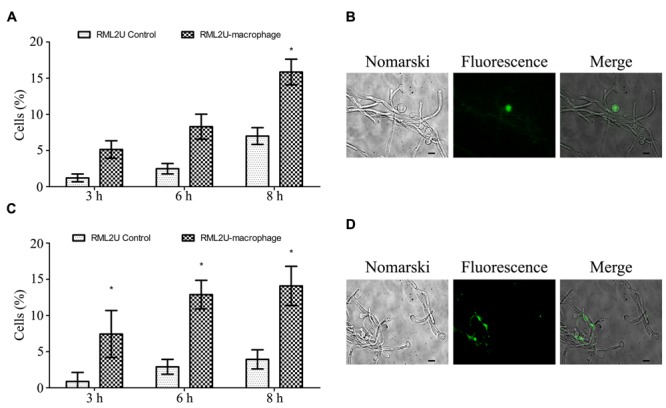
Measurement of the apoptotic status of C. albicans strains after the interaction with murine macrophages. (A) Percentage of C. albicans cells that contain ROS after 3, 6, and 8 h of macrophage interaction. (B) Representative fluorescence images of C. albicans culture stained with DHR 123. (C) Percentage of C. albicans cells with active caspase revealed by the caspase inhibitor VAD-FMK-FITC. (D) Representative fluorescence micrographs showing caspase activity in C. albicans cells. Statistically significant differences relative to the RML2U control are indicated (∗p < 0.05).