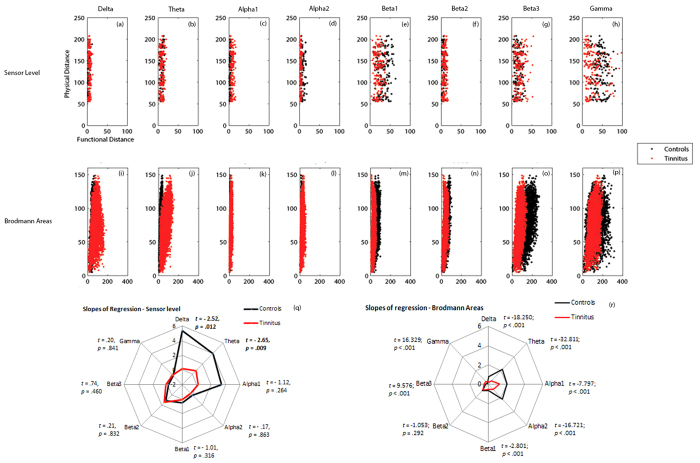
Figure 5. Correlation of physical distances and functional distances between pair-wise (a–h) sensors and (i–p) Brodmann areas in controls (black) and tinnitus (red) in delta, theta, alpha1, alpha2, beta1, beta2, beta3 and gamma frequency bands.
Comparison of the slopes of regression of the physical distance over functional distance between pairwise combination of (q) sensors and (r) Brodmann areas in controls (black) and tinnitus (red) subjects in the eight frequency bands.

