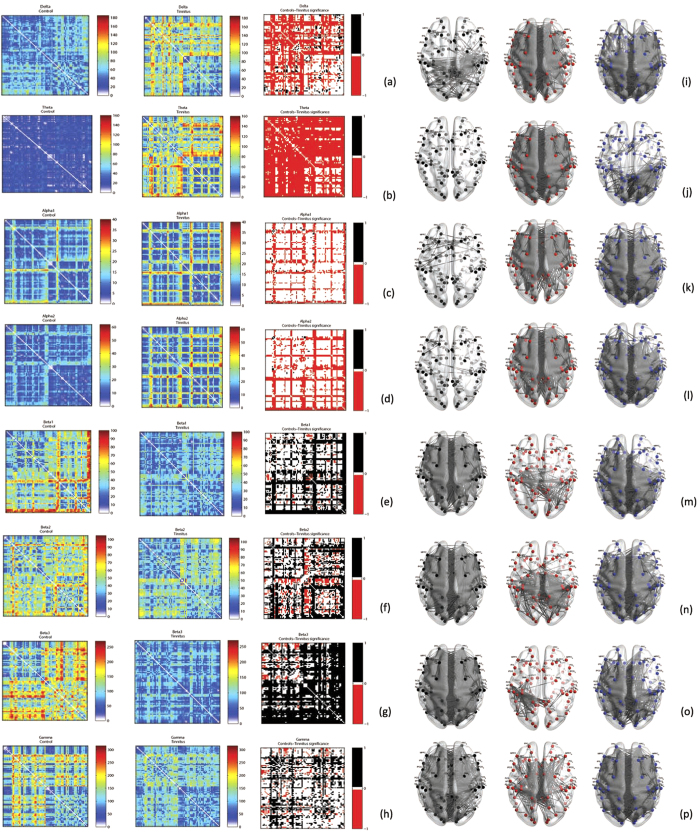
Figure 6.
(a–h) Correlation matrices of functional distances between pairwise combination of Brodmann areas in left: Controls and middle: Tinnitus, and the right: significant differences between these measures in tinnitus and controls calculated by Fischer transformation analysis in (a) delta, (b) theta, (c) alpha1, (d) alpha2, (e) beta1, (f) beta2, (g) beta3 and (h) gamma frequency bands. In the right panel, the areas in red correspond to those pairs of areas between which the functional distance in the tinnitus is significantly longer than the controls, the areas in black correspond to those pairs of areas between which the functional distance in controls is significantly longer than tinnitus and the areas in white are those pairs of areas between which there is no significant difference in functional distance between tinnitus and controls. (i–p). The network containing the actual connections whose functional distance between Brodmann areas are left: significantly longer in controls, middle: significantly longer in tinnitus subjects and right: not significantly different between the two groups in (i) delta, (j) theta, (k) alpha1, (l) alpha2, (m) beta1, (n) beta2, (o) beta3 and (p) gamma frequency bands.

