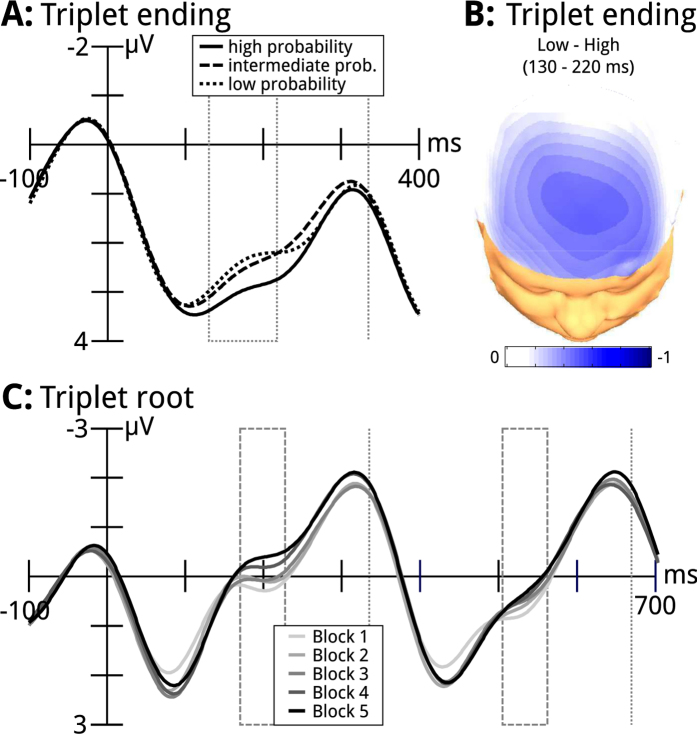
Figure 2. ERP results.
(A) Mean ERP waves of triplet endings (averaged across participants), recorded at Fz (−100–400 ms relative to the onset of the third triplet item). ERPs are shown separately for high (solid line), intermediate (dashed line), and low probability endings (dottes line). The area within the dotted rectangle indicates the time window used for statistical analysis (130–220 ms). The dotted vertical line indicates the onset of the subsequent timbre (i.e., the beginning of the next triplet). Compared to high probability triplet endings, endings with low and intermediate probability elicited a frontal negativity (this effect was larger for low than for intermediate probability endings). (B) Isopotential map showing the scalp distribution of the negativity evoked by low probability endings compared to high probability endings for the time window used for statistical analysis (difference potential: high subtracted from low probability endings). (C) Mean ERP waves of triplet roots (i.e., first and second items of triplets), recorded at Fz (−100–700 ms relative to the onset of the triplet root), separately for each of the five blocks. The dashed rectangle indicates the time window used for statistical analysis (170–230 ms). The dashed vertical lines indicate onsets of stimuli (i.e., onset of the second and third triplet item).

