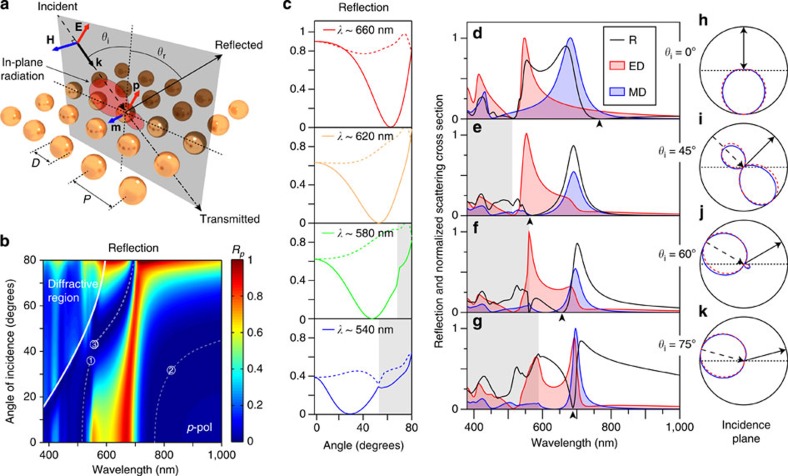
Figure 3. Simulated optical response of arrays of silicon spheres under p-polarized oblique incidence.
(a) Scheme of the simulated system. (b) Numerically calculated reflection versus wavelength and angle of incidence for a square lattice of silicon spheres with diameter D=180 nm and pitch P=300 nm. The diffractive region is indicated and delimited by a thick, solid, white line. The light-white, dashed lines are guides to the eye to help identifying the low reflectivity regions of interest. (c) Reflection versus angle of incidence for selected wavelengths showing the strong dependence of Brewster's angle on wavelength as well as the possibility of achieving values below 45°. Solid lines correspond to p-polarization while dashed lines are the corresponding curves for s-polarization. Grey-shaded areas mark the spectral regions affected by diffraction. (d,g) Reflection (black curve), together with electric dipole (red curve and corresponding shaded area) and magnetic dipole (blue curve and corresponding shaded area) contributions to scattering (normalized to their common maximum) as a function of wavelength for the cases of normal incidence and oblique incidence with θi=45, 60 and 70°, respectively. Diffractive region is indicated by a shaded grey area. (h–k) Radiation patterns in the plane of incidence numerically computed via Stratton–Chu formulas (blue solid curve) and from the induced electric and magnetic dipoles only (red dashed curve) at the wavelength of minimum reflection (arrow heads in d–g respectively). Incidence and reflection direction are shown by arrows.

