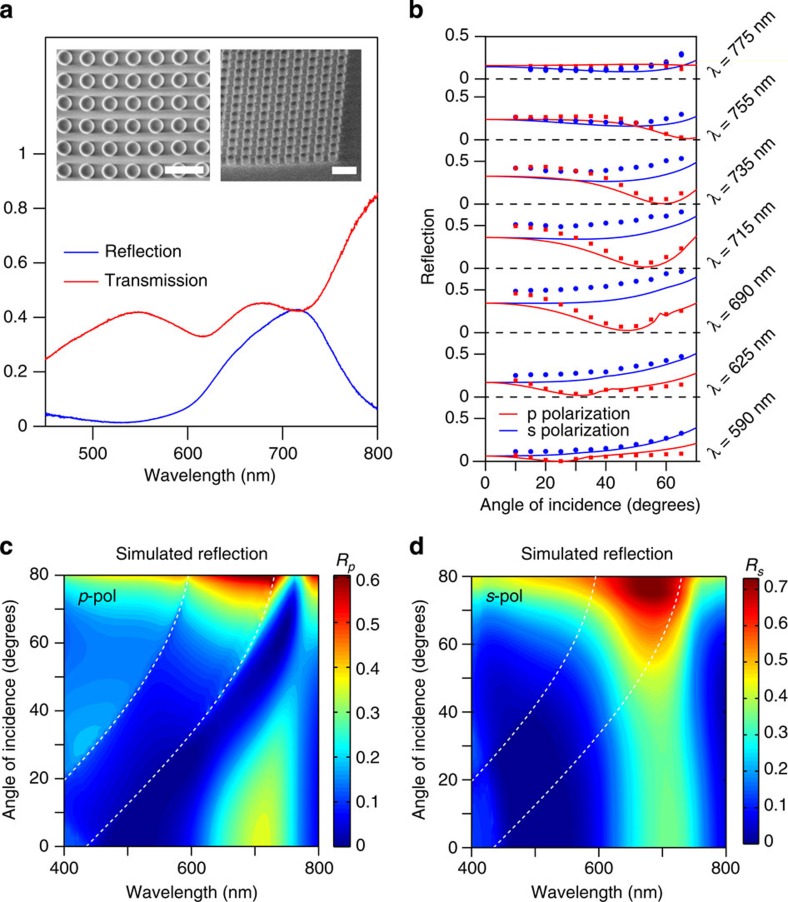
Figure 5. Angular reflection of light from arrays of silicon nanodisks over a glass substrate.
(a) Experimentally measured reflection (blue solid curve) and transmission (red solid curve) of a square lattice of silicon disks with diameter D=180 nm, height H=150 nm and pitch P=300 nm under normal incidence. The insets show the top (left) and tilted (right) SEM images of the measured sample. Scale bar, 500 nm. (b) Reflection versus angle of incidence measured for different wavelengths under p-polarized (red circles) and s-polarized (blue circles) illumination. The corresponding simulated data, obtained for D=170 nm and H=160 nm with the same pitch are shown as solid curves. (c,d) Maps of simulated values of reflection as a function of angle of incidence and wavelength for p-polarized and s-polarized incidence, respectively. White dashed lines indicate the onset of the different diffraction orders.

