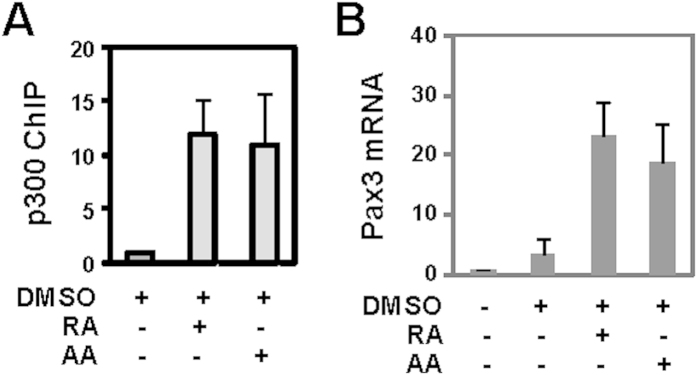
Figure 4. Enrichments of transcriptional coactivator p300 at the Pax3 locus.
(A) Cells were differentiated with RA (10 nM) or arotinoid acid (AA, 1 nM) in the presence of 1% DMSO during EB formation and qChIP was used to examine enrichment of p300 at the Pax3 locus on day 4 of differentiation. Quantification is presented as the fold change in reference to DMSO control. Error bars represent the standard deviations of four independent experiments. Input DNA was used as internal controls. (B) Real-time PCR was used to determine the mRNA levels of Pax3 in parallel, and presented as the fold changes in reference to untreated EBs normalized to GAPDH (n = 3).

