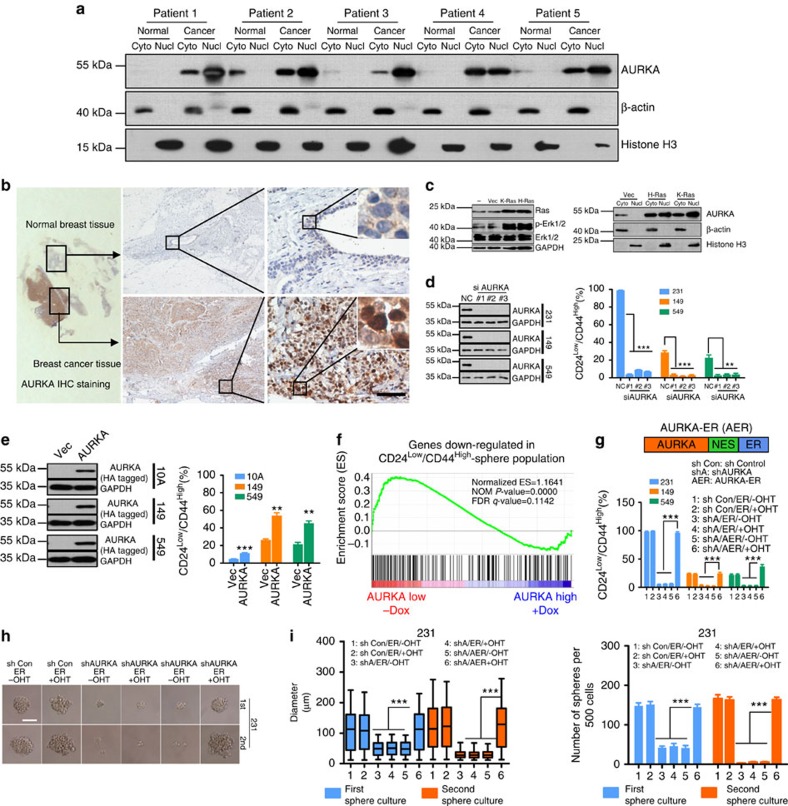
Figure 1. Nuclear AURKA enhances breast cancer stem cell phenotype.
(a) Primary cells were extracted from breast cancer tissues and adjacent normal breast tissues. The cytoplasmic and nuclear protein lysates representing an equal number of cells were subjected to immunoblot (IB) analysis. (b) Representative IHC staining showing AURKA expression. Images were magnified with a × 4 or × 40 objective. Scale bar, 50 μm. (c) Mouse embryonic fibroblasts (MEFs) overexpressing K-Ras, H-Ras and the vector control (Vec) were analysed by IB for indicated antibodies (left panel). Cytoplasmic and nuclear lysates of WT (−)-, vector control (Vec)-, K-Ras- and H-Ras-overexpressed MEFs were subjected to IB analysis (right panel). (d) MDA-MB-231, SUM149 or BT549 cells were treated with AURKA siRNAs for 96 h. Adherent cells were collected for IB analysis (left panel), CD24/CD44 staining and CD24low/CD44high population analysis via flow cytometry (right panel). (e) HA-tagged AURKA was overexpressed in MCF-10A, SUM149 and BT549 cells through lentivirus-mediated gene transfer. Puromycin (1 μg ml−1) selected cells were collected for IB analysis (left panel), CD24/CD44 staining and CD24low/CD44high population analysis by using flow cytometry (right panel). (f) Gene expression data acquired from a public database (GEO ID: GSE23541, the group of AURKA+Dox and AURKA-Dox) were subjected to GSEA using the gene expression signature that was downregulated in the CD24low/CD44high-sphere population. (g) MDA-MB-231 cells were co-transfected with shRNA vector (sh Control or shAURKA) and the overexpression vector (ER or AER) via lentivirus-mediated gene transfer. Puromycin (1 μg ml−1) and blasticidin (2 μg ml−1) double selected cells were subjected to CD24/CD44 staining and analysis via flow cytometry. (h) Cells derived from g were subjected to mammosphere culture assay (6 days, upper panel) and the secondary passaging (additional 6 days, lower panel). Scale bar, 100 μm. (i) Data from three independent experiments derived from g were used for quantitative analysis of mammosphere size (diameter, Φ) and mammosphere number. Left panel shows distribution pattern of mammosphere size from MDA-MB-231 (Kruskal–Wallis test followed by Dunn's multiple comparison test, ***P<0.001). Right panel shows the number of mammospheres (Φ>60 μm). Bars represent the means±s.e.m. of three independent experiments (analysis of variance (ANOVA) followed by least significant difference (LSD) test; *P<0.05, **P<0.01, ***P<0.001).

