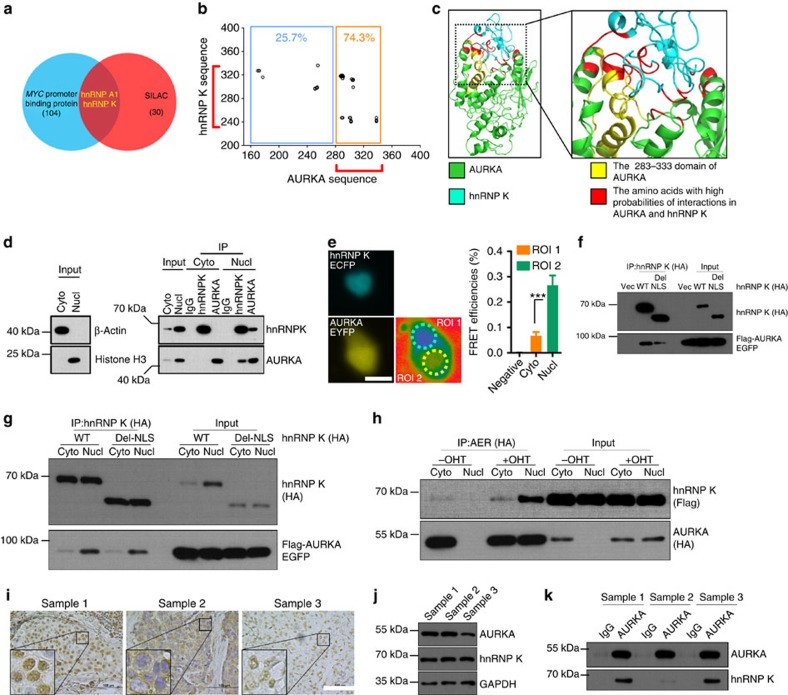
Figure 3. AURKA and hnRNP K efficiently interacts in the nucleus.
(a) AURKA-interacting proteins were identified using SILAC assay (red area). MYC promoter-regulating proteins were previously reported (blue area). Proteins presented in both categories were selected for further analysis. (b) Thirty-five combinations of the amino acid derived from AURKA and hnRNP K with high probabilities of interactions were used to compile a dot plot. The amino acids in orange box were located in the nucleotide 283–333 region of the AURKA sequence. (c) The simulated interaction diagram of AURKA and hnRNP K. KI domain was shown. (d) Nuclear/cytoplasmic protein fractions of MDA-MB-231 cells were subjected to IP and immunoblotting (IB) using antibodies as indicated. (e) hnRNP K-ECFP- and AURKA-EYFP-co-transfected 293T cells were subjected to FRET efficiency analysis. ROI1 and ROI2 were selected for the analysis in the cytoplasmic and nuclear regions, respectively. Enhanced cyan fluorescent protein (ECFP)- and enhanced yellow fluorescent protein (EYFP)-co-transfected cells were used as negative controls. Scale bar, 50 μm. (f) Twenty micrograms of WT or NLS deletion mutant hnRNP K were co-transfected with Flag-AURKA–enhanced green fluorescent protein (EGFP) into 293T cells for 24 h. Cells were then subjected to IP and IB using antibodies as indicated. (g) Twenty micrograms of WT or NLS deletion mutant hnRNP K were co-transfected with Flag-AURKA–EGFP in 293T for 24 h. Cytoplasmic and nuclear proteins were separated and subjected to IP and IB using antibodies as indicated. (h) Twenty micrograms of AER was co-transfected with Flag-tagged hnRNP K into 293T cells. After 6 h, AURKA nuclear translocation was induced by treatment with 200 nM OHT for 18 h. Cytoplasmic and nuclear proteins were then separated and subjected to IP and IB using antibodies as indicated. (i) Samples 1–3 were subjected to IHC staining of AURKA. Scale bar, 100 μm. (j) The lysates of samples 1–3 were subjected to IB using antibodies as indicated. (k) The lysates of samples 1–3 were subjected to IP and IB using antibodies as indicated. Bars represent the means±s.e.m. of three independent experiments (analysis of variance (ANOVA) followed by least significant difference (LSD) test; *P<0.05, **P<0.01, ***P<0.001).

