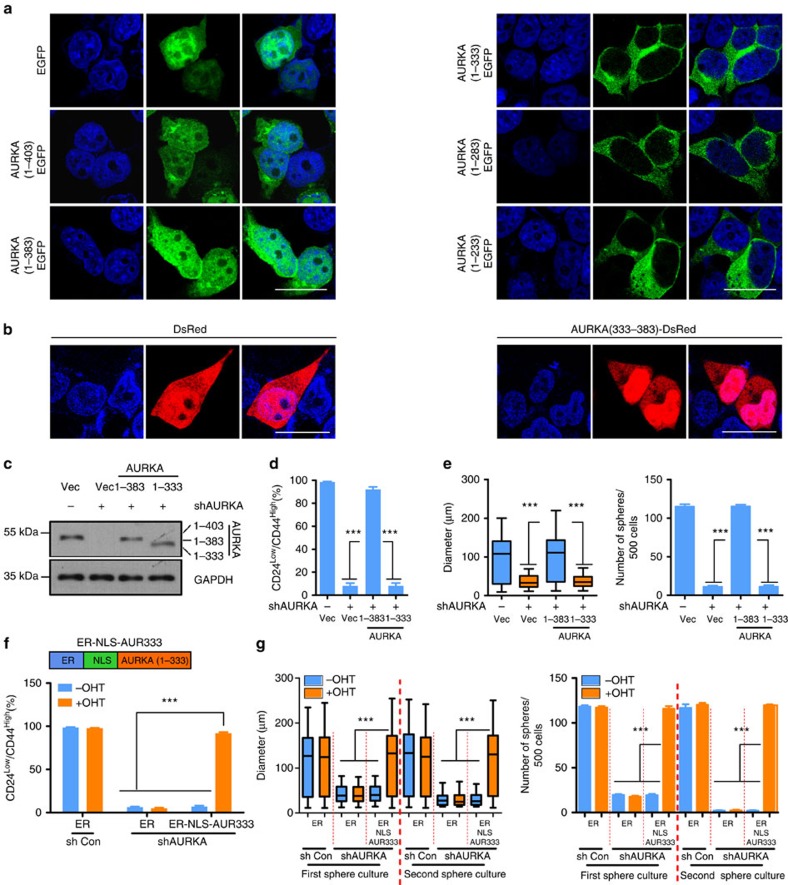
Figure 5. AURKA nuclear localization sequence is required to enhance breast cancer stem cell phenotype.
(a) Enhanced green fluorescent protein (EGFP)-fused truncated forms of AURKA were transfected into 293T cells for 24 h. The localization of EGFP-fused truncated forms of AURKA were analysed via confocal microscopy. Scale bar, 25 μm. (b) DsRed-fused 333–383 region of AURKA was transfected into 293T cells for 24 h. The localization of DsRed-fused 333–383 region of AURKA was analysed by confocal microscopy. Scale bar, 25 μm. (c,d) MDA-MB-231 cells were co-infected with lentivirus expressing AURKA shRNA (shAURKA/sh Control) and the truncated protein (1–383 or 1–333). Puromycin (1 μg ml−1) and blasticidin (5 μg ml−1) selected cells were subjected to immunoblotting (IB) analysis (c) or CD24low/CD44high population analysis via flow cytometry (d). (e) The cells in c were subjected to mammospheres culture assay for 6 days. The left panel shows the distribution pattern according to mammosphere size (Kruskal–Wallis test followed by Dunn's multiple comparison test, ***P<0.001). The right panel showed the number of Φ>60 μm mammospheres. (f) AURKA (1–333) was fused with ER via a nuclear localization sequence to generate ER-NLS-AUR333 fusion protein (upper panel). MDA-MB-231 cells were co-infected with lentivirus expressing AURKA shRNA (shAURKA/sh Control) and the fusion protein (ER-NLS-AUR333). The cells were then cultured in fresh medium for 48 h in the presence or absence of 200 nM OHT. Puromycin (1 μg ml−1) and blasticidin (5 μg ml−1) selected cells were harvested for CD24/CD44 staining and analysis via flow cytometry (lower panel). (g) The cells in f were cultured in mammosphere medium with or without 200 nM OHT. The cells were then photographed and quantified at the end of the first-round mammosphere culture (6 days) and the secondary passaging (additional 6 days). The left panel shows the distribution pattern of mammosphere size from MDA-MB-231 (Kruskal–Wallis test followed by Dunn's multiple comparison test, ***P<0.001). The right panel shows the number of mammosphere (Φ>60 μm). Data were presented as the means±s.e.m. of three independent experiments (analysis of variance (ANOVA) followed by least significant difference (LSD) test; *P<0.05; **P<0.01; ***P<0.001).

