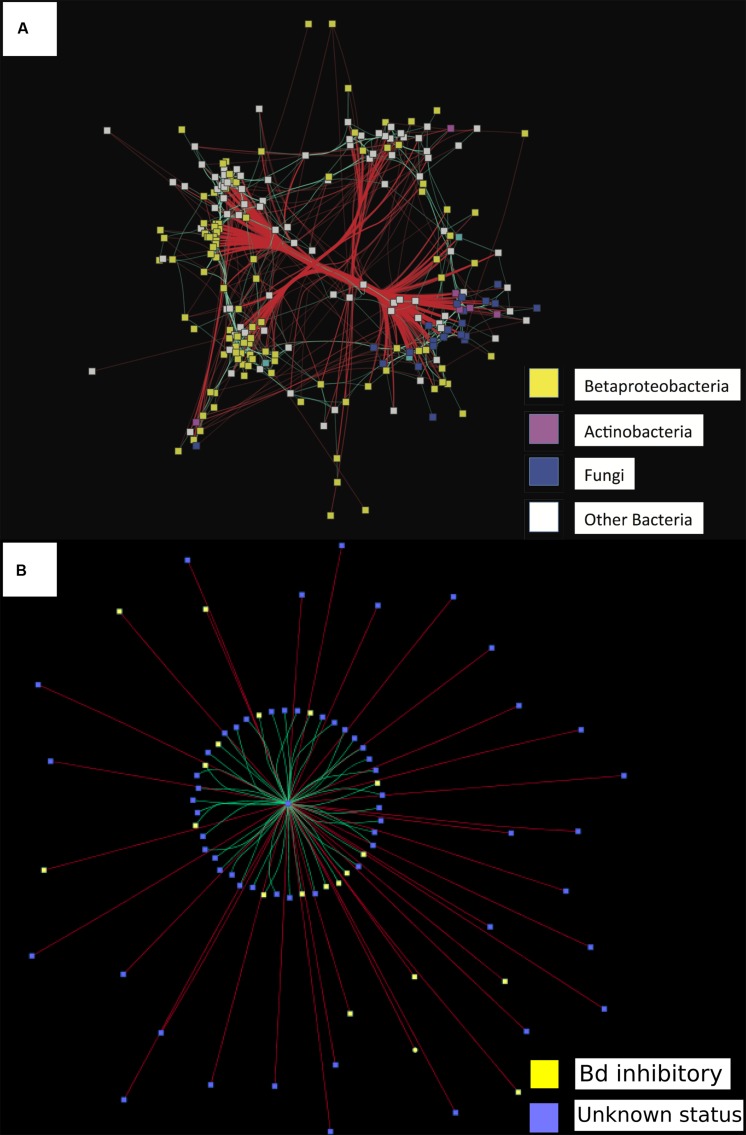
FIGURE 2.
Data showing proof of concept of a network analysis to identify correlations among bacterial and fungal operational taxonomic units (OTUs) on amphibian hosts. Network analyses depicting significantly correlated bacterial and fungal OTUs (SparCC r > 0.35). All square nodes represent OTUs (either bacteria or fungi). Red lines indicate negative correlations between two OTUs. Turquoise lines indicate positive correlations between two OTUs. (A) Assessing directionality of interactions found between all bacteria and fungal taxa. Figure adapted from Kueneman et al. (2015). Yellow = Betaproteobacteria, purple = Actinobacteria, blue = Fungi, white = other bacterial OTUs. (B) Assessing directionality of interactions found between all bacterial interactions and Pathogen Bd. Yellow = bacteria that inhibit Bd in co-culture, blue = Unknown interaction with Bd in co-culture. Center of network = fungal pathogen Bd.

