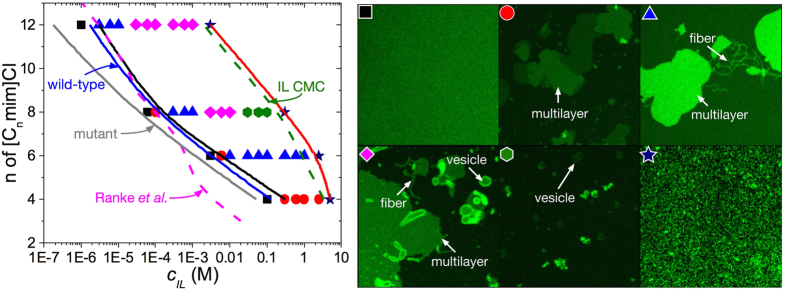
Figure 1. Phase diagram of ionic liquid induced cytotoxicity.
[Cnmim]Cl induces morphological changes to a supported α-PC bilayer. The dashed magenta line in the phase diagram corresponds to the response of EC50 to ionic liquid alkyl chain length for IPC-cell lines from Ranke et al.14. Similarly, the solid blue and grey lines depict predicted EC50 as a function of ionic liquid alkyl chain length for wild-type (with cell wall) and mutant (without cell wall) strains of Chlamydomoas reinhardtii, respectively. See Ecotoxicity Assay Details for further information about how these relationships were generated. The dashed green line corresponds to the IL critical micelle concentration (CMC) reported by Blesic et al.19 at similar ionic strengths to the confocal microscopy experiments (CMC for [C4mim]Cl has been extrapolated). Colored symbols in the figure correspond to the specific lipid morphology as shown in the right image: black square - featureless supported lipid bilayer; red circle - multilayer; blue triangle - multilayer and fiber/tube; pink diamond - multilayer, fiber/tube and vesicle; green hexagon - vesicle; and navy star - disrupted bilayer captured at much higher detector gain to improve the image quality. The size of all the micrographs is 30 μm by 30 μm and represents a top-down view of a fluorescently labeled lipid bilayer adsorbed onto a solid support. The solid black and red lines correspond to the onset of supported lipid bilayer disruption and the total disruption of the supported lipid bilayer, respectively.

