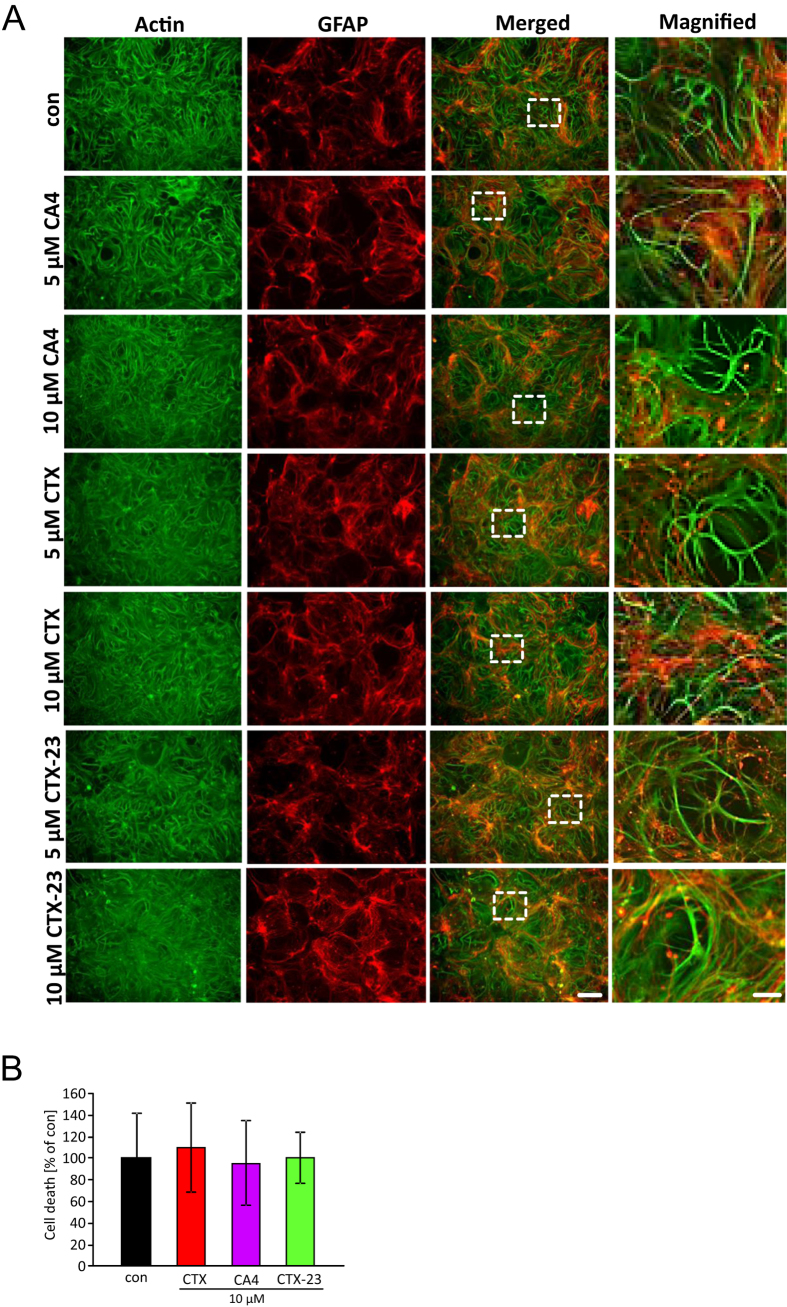
Figure 5. CA4, CTX and CTX-23 toxins do not affect primary astrocytes and neurons.
(A) Representative images of CTX, CA4 and CTX-23 treated astrocytes and neurons. The duration of treatment was 48 hours. Actin is given in green. GFAP is shown in red. Inserts display higher magnification of merged images. Scale bar represents 100 μm. Scale bar of magnification of inserts displays 20 μm. (B) Quantification of PI staining in CTX, CA4 and CTX-23 treated astrocytes and neurons. Means are given as ± SD, n = 5 per group, *P < 0.05 (Student’s unpaired t-test).

