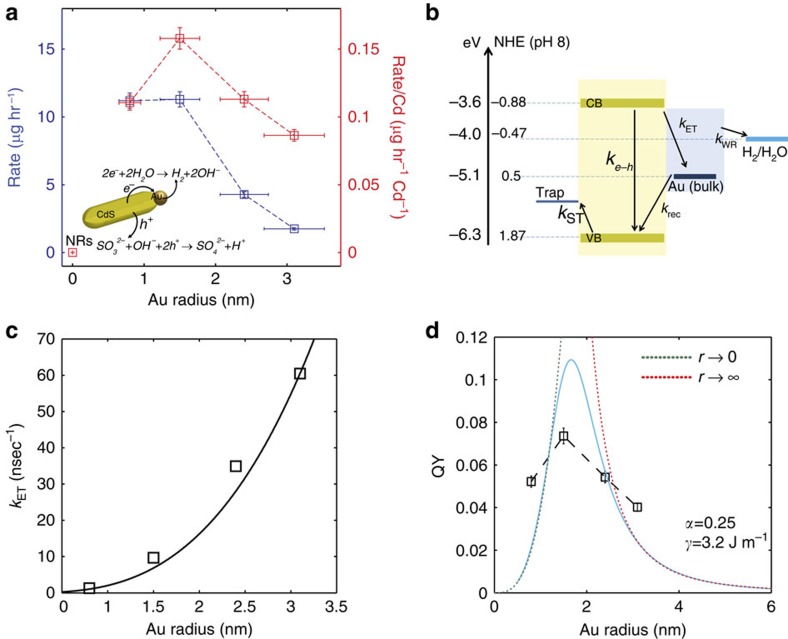
Figure 3. Understanding size-dependent hydrogen production yield.
(a) Hydrogen production rate (blue) and Cd normalized rate (red) curves as a function of Au size domain in the hybrid nanoparticles. Negligible rates are measured for the CdS NRs. (b) Energy band alignment diagram with relevant photocatalytic processes kinetic routes. (c) Measured semiconductor-metal electron transfer (kET) rates (squares) and fitting modified Fermi golden rule model for this process (solid line). (d) Measured QY (black squares connected by dashed line) along with the non-monotonic kinetic model behaviour (blue solid line). Green and red dotted lines present limiting behaviours of the model for zero and infinite metal domain sizes, respectively. Error bars in a and d indicate the Au tip size distribution and the uncertainty in the hydrogen production rate.

