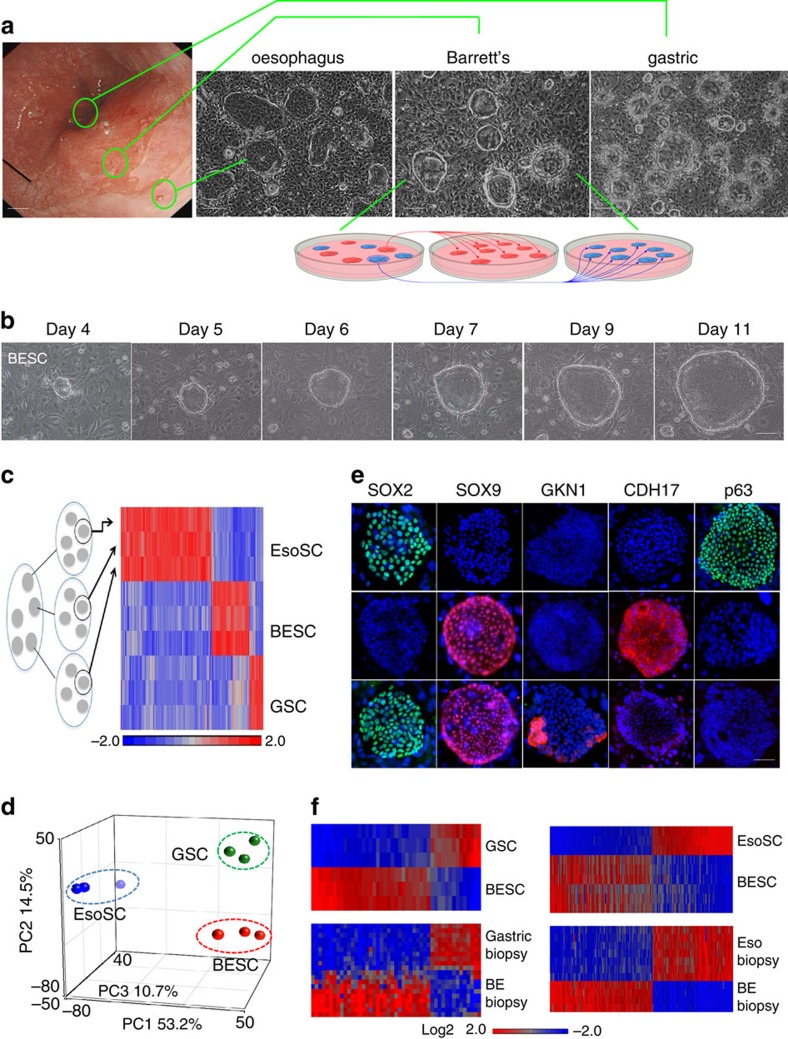
Figure 1. Stem cells from the distal oesophagus of Barrett's patient.
(a) Left, Endoscopic image of distal oesophagus of a Barrett's patient and approximate locations of biopsies. Right, phase contrast images of typical colonies derived from biopsies. Inset diagram, schematic of cloning process to yield Barrett's or oesophageal stem cell pedigrees from mixed population from Barrett's biopsies. Scale bar, 150 μm. n=12 biological replicates. (b) Colony formation from a single stem cell over indicated days in culture. Scale bar, 50 μm. (c) Heatmap of differential gene expression of three independent pedigrees from each of oesophageal (EsoSC), Barrett's (BESC) and stomach (GSC) stem cells. (d) PCA of expression data of three pedigrees each of oesophageal, Barrett's and stomach stem cells. (e) Representative immunofluorescence labelling of colonies of EsoSC, BESC and GSC with antibodies to the indicated marker proteins (green or red) with nuclei counterstained with DAPI (blue). Scale bar, 50 μm. n=12 biological replicates. (f) Gene expression heatmap comparing those differentially expressed between immature GSC (n=3) and Barrett's stem cells (BESC; n=3) with those from endoscopic gastric biopsy and Barrett's biopsies (BE-biopsy) (GSE34619) (ref. 20).

