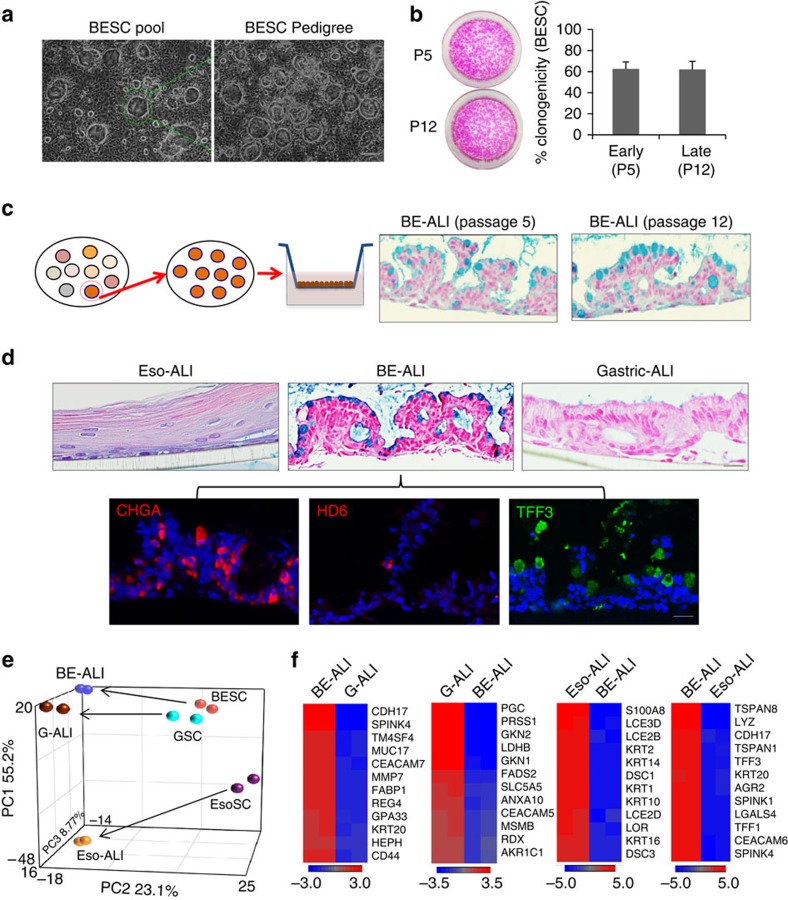
Figure 2. Barrett's stem cell pedigree recapitulates intestinal metaplasia.
(a) Derivation of stem cell pedigree from pool of colonies (left) by selecting individual colony for replating and expansion (right). Scale bar, 200 μm. n=12 biological replicates. (b) Clonogenicity assay for BESC at passage 5 and passage 12 determined by plating 2,000 cells and counting colony formation following Rhodamine red staining. Histogram depicting colony counts. Error bars, s.d. n=3 biological replicates. (c) Left, schematic diagram of induced differentiation of stem cell pedigree in ALI culture. Right, histological section of differentiated p5 and p12 Barrett's stem cells with Alcian blue-positive goblet cells. Scale bar, 100 um. n=12 biological replicates. (d) Upper, Alcian blue staining of ALI culture differentiation of EsoSC, BESC and GSC, bottom, immunostainings of section of BESC-derived epithelium following ALI differentiation showed distribution of multiple types of cells positive for CHGA (endocrine cells), HD6 (Paneth cells) and TFF3 (goblet cells). Scale bar, 50 μm. n=12 biological replicates. (e) PCA of whole-genome expression data sets from EsoSC, BESC and GSC before and after ALI differentiation as indicated. (f) Expression heatmap of differentially expressed genes in ALI cultures as indicated.

