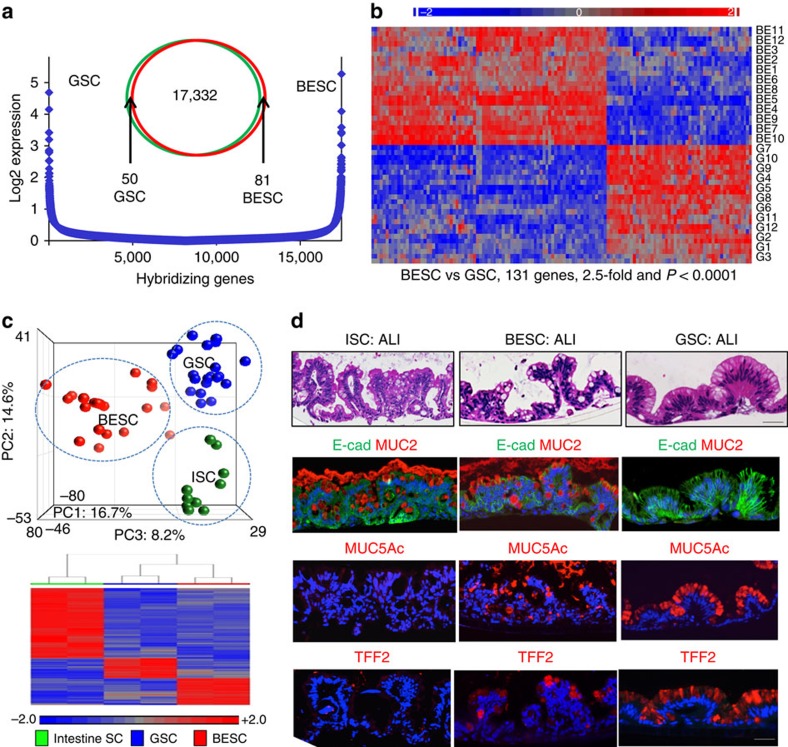
Figure 3. Stem cells of the gastroesophageal junction.
(a) Comparison of gene expression microarray data from Barrett's and gastric stem cells by Log2 expression distribution and Venn diagrams. (b) Gene expression heatmap of patient-matched BESC and GSC pedigrees showing relative expression of the 131 most differentially expressed genes between BESC and GSC (>2.5-fold, P<0.0001). (c) Top, PCA of whole-genome expression microarray data of BESC, GSC and stem cells of human fetal intestine (ISC)16. Bottom, heatmap of differentially expressed genes between BESC, GSC and ISC. (d) Histological sections of ALI-differentiated ISC, BESC and GSC stained with (from top) H&E, E-cadherin (E-cad) and mucin 2 (Muc2) antibodies, mucin 5AC (Muc5AC) antibodies and Trefoil factor 2 (TFF2) antibodies. Scale bar, 50 μm. n=12 biological replicates.

