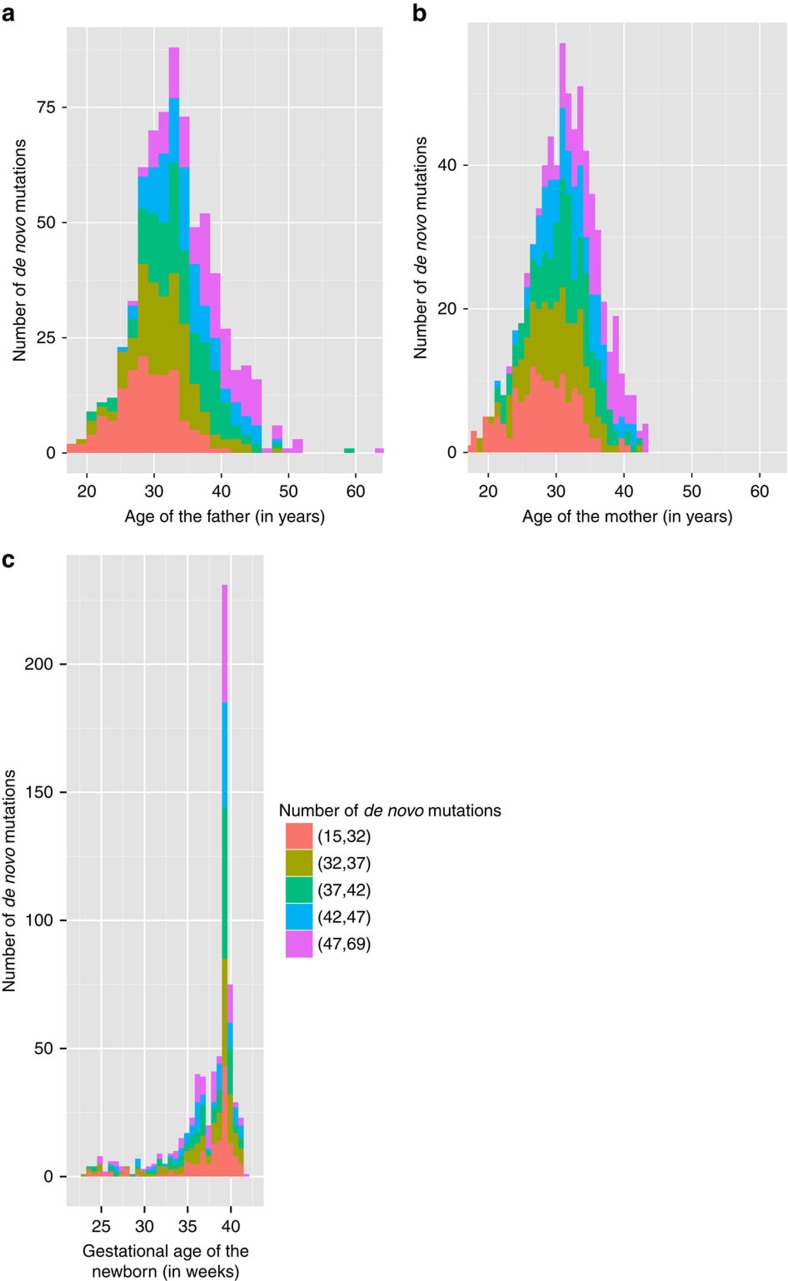
Figure 1. Parents' age distribution with number of de novo mutations in their offsprings.
(a) The distribution of father's ages at conception (in years). (b) The distribution of mother's ages at conception (in years). (c) The distribution of gestational age for the newborns (in weeks). The colours in each bar in the histograms indicate the proportion of newborns with each number of DNMs in each of the five equally sized bins.

